Download
1 / 55
940 likes | 2.45k Vues
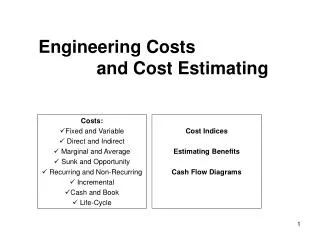
Chapter 2 Engineering Costs and Cost Estimating Chapter Outline Engineering Costs Cost Estimating and Estimating Models Learning Objectives Understand various cost concepts Understand various cost estimation models Be able to estimate engineering costs with various models

E N D
Chapter 2Engineering CostsandCost Estimating CIE412 Chapter 1a
Chapter Outline • Engineering Costs • Cost Estimating and Estimating Models CIE412 Chapter 1a
Learning Objectives • Understand various cost concepts • Understand various cost estimation models • Be able to estimate engineering costs with various models CIE412 Chapter 1a
Vignette: North Slope Natural Gas Pipeline • Alaska North Slope Natural Gas: • 35 trillion cubic feet (TCF) reserve • U.S. market: • Annual U.S. natural gas demand: 18 TCF by 2010 • Estimated consumption rate: increase 2-3% annually • Project: Bring Alaska North Slope natural gas to U.S. • Estimated infrastructure costs: $20 billion • Estimated project duration: 9-year • Design capacity: 4.5 billion cubic feet per day CIE412 Chapter 1a
Vignette: North Slope Natural Gas Pipeline • Project Alternatives: • #1: 2,140 miles of pipeline from Prudhoe to Chicago • #2: 800 miles of pipeline from Prudhoe to liquefaction plant, then shipped on ocean-going tankers • Questions to Consider: • What type of cost estimating should be utilized? • When a project is estimated to take 5-10 years to complete, should cost estimates be adjusted for inflation, regulatory changes, and changes in economic environment? • Should large-scale project be required to meet the same rate of return requirements as smaller projects? • Are there any ethical issues related to economics, the environment, safety, etc., that should be considered? CIE412 Chapter 1a
Types of Costs • Fixed Costs & Variable Costs • Marginal Costs & Average Costs • Sunk Costs & Opportunity Costs • Recurring & Non-recurring Costs • Incremental Costs • Cash Costs & Book Costs • Life-Cycle Costs CIE412 Chapter 1a
Fixed Costs and Variable Costs • Fixed Costs: constant, independent of the output or activity level. • Property taxes, insurance • Management and administrative salaries • License fees, and interest costs on borrowed capital • Rental or lease • Variable Costs: Proportional to the output or activity level. • Direct labor cost • Direct materials CIE412 Chapter 1a
Breakeven Analysis • Total Variable Cost = Unit Variable Cost * Quantity TVC = VC * Q • Total Cost = Fixed Cost + Total Variable Cost TC = FC + VC * Q • Total Revenue = Unit Selling Price * Quantity TR = SP * Q where TVC = Total variable cost VC = Variable cost per unit Q = Production/Selling quantity FC = Fixed costs TR = Total revenue SP = Selling price per unit CIE412 Chapter 1a
Breakeven Analysis • Breakeven point: the output level at which total revenue is equal to total cost. SP * BEP = FC + VC * BEP BEP = FC / (SP - VC) where BEP = breakeven point FC = fixed costs SP = selling price per unit VC = variable cost per unit • Applications of Breakeven analysis: • Determining minimum production quantity • Forecast production profit / loss CIE412 Chapter 1a
Breakeven Analysis Total Revenue $ Total Costs Profit Variable Costs Fixed Costs Loss Production Quantity Break-even Point CIE412 Chapter 1a
$1000 $800 $600 $400 $200 $0 Example 2-1 Total Revenue = 35X Total Costs = $225 + 20X Profit Variable Costs = 20X Fixed Costs = $225 Loss X # of Customers 25 10 20 15 5 CIE412 Chapter 1a
Marginal Costs and Average Costs • Marginal Costs: the variable cost for one more unit of output • Capacity Planning: excess capacity • Basis for last-minute pricing • Average Costs: total cost divided by the total number of units produced. • Basis for normal pricing CIE412 Chapter 1a
Sunk Costs & Opportunity Costs • Sunk Costs: Cost that has occurred in the past and has no relevance to estimates of future costs and revenues related to an alternative • Purchasing price of current equipment in deciding new equipment (except for capital gain/loss consideration) • Opportunity Costs: Cost of the foregone opportunity and is hidden or implied • Existing equipment in replacement analysis CIE412 Chapter 1a
Example 2-2 Pricing of Old Pumps • Purchase Price of Old Pumps $7,000 (Sunk) • Storage Costs of Old Pumps $1,000 (Sunk) • List Price of Old Pumps (3 yrs) $9,500 (Irrelevant) • List Price of New Pumps $12,000 (Irrelevant) • Offer of Old Pumps (2 yrs ago) $5,000 (Irrelevant) • Current Price of Old Pumps $3,000 CIE412 Chapter 1a
Recurring Costs and Non-recurring Costs • Recurring Costs: Repetitive and occur when a firm produces similar goods and services on a continuing basis • Office space rental • Non-recurring Costs: Not repetitive, even though the total expenditure may be cumulative over a period of time • Typically involve developing or establishing a capability or capacity to operate • Examples are purchase cost for real estate and the construction costs of the plant CIE412 Chapter 1a
Incremental Costs • Incremental Costs: Difference in costs between two alternatives. • Suppose that A and B are mutually exclusive alternatives. If A has an initial cost of $10,000 while B has an initial cost of $14,000, the incremental initial cost of (B - A) is $4,000. CIE412 Chapter 1a
Example 2-3 Choosing between Model A & B CIE412 Chapter 1a
Cash Costs versus Book Costs • Cash Costs: Costs that involve money/cash transaction • Interest payments, taxes, etc. • Book Costs: Costs that that do not involve money/cash transaction • Depreciation is charged for the use of assets, such as plant and equipment CIE412 Chapter 1a
Life-Cycle Costs • Life-Cycle Costs: Summation of all costs, both recurring and nonrecurring, related to a product, structure, system, or service during its life span. • Life cycle begins with the identification of the economic needs or wants (the requirements) and ends with the retirement and disposal activities. CIE412 Chapter 1a
Phases ofLife Cycle CIE412 Chapter 1a
CumulativeLife-Cycle CostsCommitted and Spent 100% 90% 80% 70% Life-Cycle Costs Committed 60% 50% Life-Cycle Costs Spent 40% 30% 20% 10% 0% Need Conceptual Detailed Production Operational Decline/ Assessment Design Design /Construction /Use Retirement CIE412 Chapter 1a
100% 90% 80% 70% 60% 50% 40% 30% 20% 10% 0% Need Conceptual Detailed Production Operational Decline/ Assessment Design Design /Construction /Use Retirement Cost/Ease of Design Changes in Product Life Cycle Ease of Design Changes Cost of Design Changes CIE412 Chapter 1a
Cost Estimating Needs for Cost Estimating • Importance of Cost Estimating • Types of Cost Estimating • Rough Estimates -30% to +60% • Semi-detailed Estimates -15% to +20% • Detailed Estimates -3% to +5% CIE412 Chapter 1a
Cost Estimating--Trade-off between Accuracy and Cost High Cost of Estimate Low Low Medium High Accuracy of Estimate CIE412 Chapter 1a
Difficulties in Estimation • One-of-a-Kind Estimates • Time and Effort Available • Estimator Expertise CIE412 Chapter 1a
Categories of Cost Estimating • Capital Investment (S&H, Installation, Training) • Labor Costs (Direct and Indirect) • Material Costs (Direct & Indirect) • Maintenance Costs (Regular & Overhaul) • Property Taxes and Insurance • Operating Costs (Rental, Gas, Electricity) • Quality Costs (Scrap, Rework, Inspection) • Overhead Costs (Administration, Sales) • Disposal Costs • Revenues • Market Values CIE412 Chapter 1a
Sources of Cost Estimating Data • Accounting records • Other sources within the firm: • Engineering, Production, Quality • Sales, Purchasing, Personnel • Published information: • Statistical Abstract of US – Cost indexes • Monthly Labor Review – Labor costs • Building Construction Cost Data • Other sources outside the firm: • Vendor, Salespeople • Research & Development • Pilot plant, Test market CIE412 Chapter 1a
Cost Estimating Approaches • Top-down Approach • Uses historical data from similar engineering projects • Modifies original data for changes in inflation, activity level, weight, energy consumption, size, etc…. • Best use is early in estimating process • Bottom-up Approach • More detailed cost-estimating method • Attempts to break down project into small, manageable units and estimate costs, etc…. • Smaller unit costs added together with other types of costs to obtain overall cost estimate • Works best when detail design is available CIE412 Chapter 1a
Cost Estimating Models • Per-Unit Model (Unit Technique) • Segmenting Model • Cost Indexes • Power-Sizing Model • Triangulation • Improvement and the Learning Curve CIE412 Chapter 1a
Cost Estimating Models -- Per-Unit Model (Unit Technique) • Per-Unit Model (Unit Technique) • Construction cost per square foot (building) • Capital cost of power plant per kW of capacity • Revenue / Maintenance Cost per mile (hwy) • Utility cost per square foot of floor space • Fuel cost per kWh generated • Revenue per customer served CIE412 Chapter 1a
Example 2-4 Cost Estimating using Per-Unit Model Cost estimation of camping on an island for 24 students over 10 days. Planned Activities: • 2 days of canoeing • 3-day hikes • 3 days at the beach • Nightly entertainment CIE412 Chapter 1a
Cost Data: • Van (capacity 15) rental: $50 one way • Camp is 50 miles away, van gets 10 miles/gallon, and gas is $1/gallon • Each cabin holds 4 campers, rent is $10/day-cabin • Meals are $10/day-camper • Boat transportation is $2/camper (one way) • Insurance/grounds fees/overhead is $1/day-camper • Canoe (capacity 3) rentals are $5/day-canoe • Day hikes are $2.50/camper-day • Beach rental is $25/group-(half-day) • Nightly entertainment is free Example 2-4 Cost Estimating using Per-Unit Model CIE412 Chapter 1a
Solution: • Assumption: 100% participation in all activities • Transportation Costs: • Van: $50/van-trip * 2 vans * 2 trips = $200 • Gas: $1/gallon * (50 miles / 10 miles/gallon) *2 *2 = 20 • Boat: $2/camper-trip * 24 campers * 2 = 96 • Subtotal $316 • Living Costs: • Meals: $10/day-camper * 24 campers * 10 days = $2400 • Cabin rental: $10/day-cabin * (24/4) cabins *10 days = 600 • Insurance: $1/day-camper * 24 campers * 10 days = 240 • Subtotal $3240 Example 2-4 Cost Estimating using Per-Unit Model CIE412 Chapter 1a
Solution (Continued): • Entertainment Costs: • Canoe rental: $5/day-canoe * 2 days * (24/3) canoes = $80 • Beach rental: $25/group-(half-day) * (3*2) half-days = 150 • Day hike: $2.50/camper-day* 24 campers * 3 days = 180 • Nightly entertainment 0 • Subtotal $410 • Total Costs: $3966 Example 2-4 Cost Estimating using Per-Unit Model CIE412 Chapter 1a
Cost Estimating Models – Segmenting Model • Estimate is decomposed into individual components • Estimates are made at component level • Individual estimates are aggregated back together CIE412 Chapter 1a
Example 2-5 Cost Estimating using Segmenting Model Cost estimate of lawn mower A. Chassis B. Drive Train CIE412 Chapter 1a
Example 2-5 Cost Estimating using Segmenting Model Cost estimate of lawn mower C. Controls D. Cutting/Collection system Total material cost = $22.45 + $72.70 + $52.70 + $25.60 = $173.45 CIE412 Chapter 1a
Cost Estimating Models – Cost Indexes • Costindexes reflect historical change in cost • Cost index could be individual cost items (labor, material, utilities), or group of costs (consumer prices, producer prices) • Indexes can be used to update historical costs (Eq. 2-2) CIE412 Chapter 1a
Example 2-6 Cost Estimating using Cost Indexes CIE412 Chapter 1a
Cost Estimating ModelsPower-Sizing Model (Eq. 2-3) X = Power-sizing exponent CIE412 Chapter 1a
A. Considering Power-Sizing Index Change Example 2-7 Cost Estimating using Power-Sizing and Cost Indexes B. Considering Cost Index Change CIE412 Chapter 1a
Cost Estimating Models – Triangulation • Techniques Used in Surveying: To map points of interest by using three fixed points and horizontal angular distance • Application in Economic Analysis: To approach economic estimate from different perspectives, such as different source of data, or different quantitative models. CIE412 Chapter 1a
Cost Estimating Models – Improvement and Learning Curve • Learning Phenomenon: As the number of repetitions increase, performance of people becomes faster and more accurate. • Learning curve captures the relationship between task performance and task repetition. • In general, as output doubles the unit production time will be reduced to some fixed percentage, the learning curve percentage or learning curve rate CIE412 Chapter 1a
Cost Estimating Models – Improvement and Learning Curve Learning Curve Let T1 = Time to perform the 1st unit TN = Time to perform the Nth unit b = Constant based on learning curve % N = Number of completed units (Eq. 2-4) (Eq. 2-5) CIE412 Chapter 1a
Cost Estimating Models – Improvement and Learning Curve Cumulative production time from N1 to N2: CIE412 Chapter 1a
Example 2-8 Cost Estimating using Learning Curve CIE412 Chapter 1a
Example 2-9 Cost Estimating using Learning Curve CIE412 Chapter 1a
Example 2-9 Cost Estimating using Learning Curve Example 2-9 Cost Estimating using Learning Curve CIE412 Chapter 1a
Example 2-9 Cost Estimating using Learning Curve Example 2-9 Cost Estimating using Learning Curve Log-Log Scale Normal Scale CIE412 Chapter 1a
Estimating Benefits • Sample Benefits • Sales of products • Revenues from bridge tolls & electric power sale • Cost reduction from reduced material or labor costs • Less time spent in traffic jams • Reduced risk of flooding • Cost concepts and cost estimating models can also be applied to economic benefits • Uncertainty in benefit estimating is typically asymmetric, with a broader limit for negative outcomes, e.g. -50% to +20% • Benefits are more difficult to estimate than costs CIE412 Chapter 1a