Download
1 / 71
710 likes | 4.16k Vues
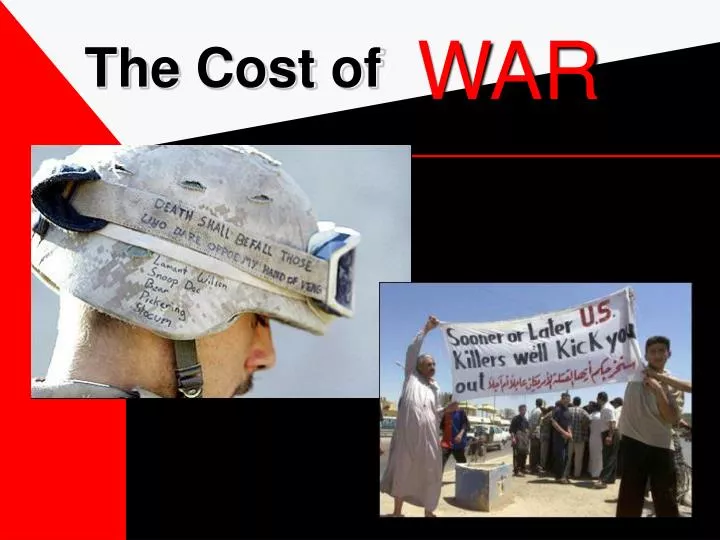
WAR The Cost of “The most significant aspect of our current strategic reality is that the Global War on Terror in which we are now engaged will be a protracted one.” - Army Posture Statement 2005, February 6, 2005 Donald Rumsfeld

E N D
WAR The Cost of
“The most significant aspect of our current strategic reality is that the Global War on Terror in which we are now engaged will be a protracted one.” - Army Posture Statement 2005, February 6, 2005
Donald Rumsfeld U.S. forces must maintain the capability, at the direction of the President, to impose the will of the United States and its coalition partners on any adversaries, including states or non-state entities. Annual Report to the President and the Congress from the Secretary of Defense, 2002
First Strike OptionChange In Doctrine The New Preemptive War Posture NATIONAL SECURITY STRATEGY OF THE UNITED STATES, September 2002 formalized a policy that was already underway. The new first strike doctrine adds “preemption” and “defensive intervention” to traditional containment and deterrence policies as formal options for striking at hostile nations or groups. This new doctrine requires new military capabilities.
Capabilities BasedChange In Doctrine “The best defense is offense” During the Cold War, policy was designed to maintain a global “balance of power” and prevent the spread of Soviet Communism. This doctrine has formally changed. Transforming from the threat-based force of the Cold War to a capabilities based force postured to respond to a wide variety of threats. Military requirements are now detached from assessments of actual security threats. U.S. military strategy is now focused on exploiting technological capabilities to the fullest and expanding U.S. military reach to every corner of the globe. Source: Nuclear Posture Review, 8 Jan. 2002
U.S. Worldwide PresenceChange In Organization • 5 Geographic Commands • NORTHCOM - U.S. North American Command • SOUTHCOM - U.S. South American Command • PACOM - U.S. Pacific Command • EUCOM - U.S. European Command • CENTCOM - U.S. Central Command • 4 Functional Commands • SOCOM - U.S. Special Operations Command • JFCOM - U.S. Joint Forces Command • STRATCOM - United States Strategic Command • TRANSCOM - U.S. Transportation Command
Five Geographic Commands - restructured to expand depth and breadth in 2002.
Forward Military Presence - New Bases American forces have been in western Europe since WWII to support NATO. Those forces will now be spread out. The United States is building 14 permanent bases in Iraq. The Pentagon is repositioning the global force to put troops close to every hot spot or areathreatening the national interest. Turkey, Bosnia, Kosovo, Morocco, Bulgaria, Romania, Poland, Pakistan, India, Uzbekistan, Kazakhstan, Turkmenistan, Australia, Singapore, Malaysia, the Philippines, Vietnam, Tunisia, Algeria, Senegal, Ghana, Maki and Sierra Leone. Possible new U.S. overseas bases Source: American Forces Press Services, March 8, 2005
U.S. Central Command Covers the area from the Horn of Africa through the Persian Gulf, into Central Asia. That includes Iraq, Afghanistan, Iran, and the Caspian Sea area.
OIL & GAS OIL & GAS OIL & GAS OIL & GAS Potential New U.S. Bases Threatening the national interest ...
A Growing Need Since 2001, the U.S. military has deployed more than 1 million troops for the wars in Iraq and Afghanistan. Ready troop strength is stretched thin by the wars in Iraq and Afghanistan 341,000, or nearly one third, have served 2 or more overseas tours. Source: Ann Scott Tyson, Washington Post, Feb. 3, 2005
A permanently larger Army ... Paul D. Wolfowitz, as Deputy Defense Secretary warned of “a very difficult road ahead” in Iraq. Testimony before the Senate Armed Services Committee February 3, 2005. The increase in troops for Iraq has been paid for primarily through supplemental appropriations. In early 2005 a decision was made to make the 3-year temporary troop increase permanent starting FY 2007. Source: US TO PULL 15,000 TROOPS OUT OF IRAQ, Washington Post, February 4, 2005
… on a permanently enlarged battlefield Proposed New U.S. Bases Proposed Future GWOT Bases Major Overseas Cold War Bases Iraq & Afghanistan
Major U.S. Oil Imports & Expanding Natural Gas Development Eastern Europe and FSU has 36.3% of the worlds natural gas and potentially enough oil to add 10% to the reserves U.S. Oil/Gas Imports Expanding Gas Production The Middle East has 66.3% of the worlds oil reserves and 36.3% of the natural gas Major Gas Reserves Source: Oil & Gas Journal, 2001
94% of the world’s oil was state-owned before the Iraqi invasion.Nation-states grant concessions to foreign companies for exploration and extraction. Oil & Gas Production and New Bases U.S. Oil/Gas Imports Future Gas Production Proposed Future GWOT Bases Major Overseas Cold War Bases Iraq & Afghanistan Major Gas Reserves
Cost of War Combat Deaths
Killed In Iraq U.S. Military : over 1,540 Coalition Forces: over 175 Iraqi Soldiers and Insurgents: 24,000 Civilian Contractors : over 200 Journalists, UN & Aid Workers:over 60 Iraqi Civilians: from 16,000 to 100,000 April 2005
Fallen U.S. Soldiers Lance Corporal Jose Gutierrez U.S. Marine Corps Died March 21, 2003 in combat Age: 22 Hometown: Los Angeles Among the First to Die
Deaths Under Age 25 Who Is Dying? = 50.4% 80% of U.S. military deaths come from the Regular Active Duty forces. 20% are from Reserve or National Guard units. Air Force Navy Army Marines Source: Defense Manpower Data Center, Statistical Information Analysis Division
Cause of Death - Hostile Operation Iraqi Freedom Two Years of War Hostile Fire IED Source: Department of Defense Casualty Statistics
Is It Getting Better? DeathsYear 1Year 2 Total 585 925 Per Week 11.0 17.8 The Government has limited media coverage of returning coffins and military funerals. More Americans died in the second year of the War than in the first. 58%
The Wounded & The Sick For every military death in Iraq 9 more are wounded in combat. But … 12 more are evacuated for non-hostile injuries or illnesses Hostile Injuries Non-Hostile Injuries Deaths Psychiatric Source: 60 Minutes, Salon.com, Antiwar.com
Is It Getting Better? WoundedYear 1Year 2 Total 2,988 8,297 Per Week 56.4 159.6 More Americans were combat wounded in the second year of the War. 178%
Non-Hostile Injuries & Illnesses By March 2005, 20,432 people had been evacuated from Iraq or Afghanistan with non-hostile injuries or illnesses. The official Pentagon casualty count includes non-hostile, in-theater deaths but does not include non-hostile injuries or illnesses. • Non-hostile injuries and illnesses include: • injuries sustained in accidents • heart problems and other non-combat illness • friendly fire • mental health issues • environmental exposures
Coalition Casualties - xTotals Coalition Deaths 1,667 Hostile Injuries 11,220 Non-Hostile Injuries and Illnesses 20,432 Psychiatric or Behavioral Health 1,635 (based on 8% of non-hostile casualties) Total34,954 Over 30% of Gulf War I vets are chronically ill. Tip of the Iceberg To date, 221,000 Gulf War I veterans are receiving disability benefits for combat-related injuries and illnesses in that war - a war that lasted 6 weeks with just 382 fatalities and 467 injured. March 2005 Source: Veterans Affairs, Gulf War Veterans Association, multiple newspaper sources; March 2005
Iraqi Casualties “We don’t do body counts.”General Tommy Franks Under pressure from Congress, DoD has estimated 24,000 insurgents have been killed. No one has been able to keep a realistic record of Iraqi casualties. However, there are several estimates. iraqbodycount.net has been keeping track of publicized civilian deaths since the beginning of the invasion by combing news reports from all over the world. Their estimates as of March 8, 2005: Estimated civilian deaths I: 16,214 - 18,491
The Lancet Estimate Estimated civilian deaths II: 100,000 46% were children younger than 15 7% were women 46% were adult men Iraqi’s are now 58 times more likely to die a violent death than they were before the invasion. The Lancet is Britain’s medical journal. Two teams conducted a door-to-door survey throughout Iraq asking about deaths before and after the invasion. They extrapolated their results to reflect the entire population. Source: The Lancet, October 2004
Commanders & Businessmen
Arms Sellers and Buyers Arms Exports 2003 Arms Imports 2003 U.S. U.K. Russia, Ukraine U.S. U.K. Eastern Europe Asia Western Europe & Canada Middle East and Caspian Sea Area Source: UN Human Development Report 2004
The U.S., Russia, France, Germany and Britain make 82% of the world’s arms sales. Asia, the Middle East, and Eastern Europe are the major buyers. Billions Source: UN Human Development Report 2004
The average CEO at a major defense contractor made 577 times as much as an Army private in 2002. Median CEO pay at the 37 largest defense contractors rose 79% from 2001 to 2002,while overall CEO pay climbed only 6%. Source: Business Week & United for a Fair Economy
Who Has Benefited From the GWOT the Most? Halliburton - 559% increase L-3 Communications - 452% increase
Businessmen & Politicians
Since 2000, corporate profits have increased $235.5 Billion, a rise of 42.2% over 4 years(10.5% average per year). From 1960 to 2000, the average yearly increase had been 4%-6.5%. Source: Bureau of Economic Analysis, U.S. Department of Commerce
Political Contributions The oil and gas industry has contributed $179.7 million since 1989 to federal candidates and political parties, 74% to Republicans. The U.S. security-energy industry has removed itself from accountability while writing U.S. policy behind closed doors. • ChevronTexaco • - $8.9 million in individual, PAC and soft money donations xxsince 1989 (75% to Republicans) • - $38 million to lobby Congress since 1997 • Exxon Mobil • - $8.2 million in individual, PAC and soft money donations xxsince 1989 (87% to Republicans) • - $62 million to lobby Congress since 1997 Source: The Money Behind the Debate Over Drilling in ANWR, CapitalEye, March 18, 2005
The U.S. Government Is Run By Energy and Defense Industry Executives • Top Bush Administration officials who have managed, provided professional services for or sat on boards of • BOTH ENERGY AND DEFENSE COMPANIES • Dick Cheney, Vice President • Donald Rumsfeld, Secretary of Defense • Paul Wolfowitz, President of the World Bank • Douglas Feith, Dick Cheney’s chief of staff • Robert Zoellick, U.S. Trade Representative Source: The Role of the Arms Lobby, World Policy Institute, May 2002
Top Bush Administration officials who have managed, provided professional services for or sat on boards of • ENERGY COMPANIES • George W. Bush, President • Condoleezza Rice, Secretary of State • … or were partners in firms representing ENERGY COMPANIES • Alberto Gonzales, Secretary of Department of Justice • … or worked as consultants, advisors or lobbyists • Zalmay Khalilzad, Special Envoy to Iraq Source: The Role of the Arms Lobby, World Policy Institute, May 2002
Top Bush Administration officials who have managed, provided professional services for or sat on boards of • DEFENSE INDUSTRY COMPANIES • Dick Cheney, Vice President - Brown & Root Saudi Limited Co. board • Lynn Cheney, wife of VP - Lockheed Martin board • I. Lewis Libby, Dick Cheney’s chief of staff - Northrop Grumman xconsultant • Robert Zoellick, US Trade Representative - Said Holdings board • Donald Rumsfeld, Secretary of Defense - Gulfstream Aerospace (now xGeneral Dynamics) board • Paul Wolfowitz, Deputy Secretary of Defense - Northrop Grumman xconsultant • Stephen Hadley, Deputy National Security Advisor - ANSER board • Dov Zakheim, DoD Undersecretary for Comptroller - Northrop Grumman xboard • Douglas Feith, DoD Undersecretary for Policy - law firm representing xseveral defense contractors • David Chu, DoD Undersecretary for Personnel & Readiness - Rand VP • Larry C. Thompson, Deputy Attorney General - law firm representing xLockheed Martin Source: The Role of the Arms Lobby, World Policy Institute, May 2002
Top Bush Administration officials who have managed, provided professional services for or sat on boards of • DEFENSE INDUSTRY COMPANIES • Edward Aldridge, Jr., DoD Undersecretary for Acquisition, Technology - xAerospace CEO, McDonnell Douglas Electronics VP, several defense xcontractor boards • Michael Wynne, DoD Undersecretary - General Dynamics VP • Thomas Christie, DoD Director, Office of Independent Testing & xEvaluation - Defense Analysis board • James Roche, Secretary of the Air Force - Northrop Grumman xElectronics President • Nelson F. Gibbs, Air Force Asst. Secretary for Installation, Environment - xNorthrop Grumman comptroller • Peter B. Teets, Assistant Secretary of the Air Force - Lockheed Martin xCOO • Gordon England, Secretary of the Navy - General Dynamics Executive xVP • Robert Card, Under Secretary, Department of Energy - nuclear industry xCEO and VP • Francis S. Blake, Deputy Secretary, Department of Energy - GE senior VP Source: The Role of the Arms Lobby, World Policy Institute, May 2002
Top Bush Administration officials who have managed, provided professional services for or sat on boards of • DEFENSE INDUSTRY COMPANIES • Everet Beckner, Administrator of Defense Programs, Department of xEnergy - Lockheed Martin Deputy Chief Executive • Colin Powell, former Secretary of State - Gulfstream Aerospace (now xGeneral Dynamics) board • Grant Green, Under Secretary for Management, State Department - GMD xSolutions President and CEO • Richard Armitage, former Deputy Secretary of State - Raytheon and xMantech board + own defense consulting firm, Armitage Assoc. LLP • Otto Reich, Asst. Secretary for Latin America, Dept. of State - Lockheed xMartin lobbyist • Norman Mineta, Secretary of Transportation - Lockheed Martin VP • Michael Jackson, Deputy Secretary of Transportation - Lockheed Martin xVP and COO • John Marburger, Director, Science & Technology - Director Brookhaven xNational Laboratory • Theodore Olson, Solicitor General - Hughes Electronics professional xservices • AND MORE Source: The Role of the Arms Lobby, World Policy Institute, May 2002
Politicians & Commanders
Government Receipts =80 - 85% fromIndividual Income Taxes xxxxxxxxxxxxxxxxxx& Social Insurance Contributions. Corporate Income Taxesaccount for between 7 - 12%. • Miscellaneous - excise taxes, estate and gift taxes, customs duties, earnings by the Federal Reserve Banks and other miscellaneous Source: U.S. Dept. of the Treasury, Congressional Budget Office as of Oct. 2004
How Your Tax Dollars Get Spent Discretionary Budget Federal Budget Outlays - 2004
Discretionary Budget - 2004 2% 51% 47% 2004 Source: U.S. Dept. of the Treasury, Congressional Budget Office as of Oct. 2004 Percentage of your income taxes that go for Department of Defense, Veterans Affairs and Homeland Security Expenditures = 51%
Department of Defense spending outdistances any other Federal Agency by 600% - 1000%. Military & Security Expenditures All Other Government Spending - Minus Entitlement Programs and Interest on the Public Debt Source: U.S. Dept. of the Treasury, Congressional Budget Office as of Oct. 2004
The United States spends the lions share of the world’s defense budget. The percentage is rising due to both increases in U.S. spending in the Global War on Terror (GWOT) and decreases in spending in other countries. Saudi Arabia U.K. U.K. Japan Japan Italy Italy France U.S. 43.6% France U.S. 53.4% Germany 2000 2004 Germany Russia Russia China China Military Expenditures of the Nations With the Largest Armed Forces, % of Total Source: The Military Balance. 2003-2004 (International Institute for Strategic Studies)