Download

1 / 23
230 likes | 534 Vues
AUTOMOTIVE ADVERTISING Jon Swallen TNS Media Intelligence Please step into my time machine TVB Forecast Conf. Travel back to Sept. 6, 2007 I Said To You…. “The auto category has been a bloody mess since the middle of 2005.” Jon Swallen TVB Forecast Conference September 6, 2007

E N D
AUTOMOTIVE ADVERTISING Jon Swallen TNS Media Intelligence
TVB Forecast Conf. Travel back to Sept. 6, 2007
I Said To You…. “The auto category has been a bloody mess since the middle of 2005.” Jon Swallen TVB Forecast Conference September 6, 2007
“We keep thinking it can’t get worse but there are no indications a corner has been turned.” Jon Swallen TVB Forecast Conference September 6, 2007
$10 Billion of Lost Ad Spend In 5 Years -3.7% -6.1% -7.3% -15.7% -31.3% $20.2 $19.4 $18.2 $16.9 $14.3 $9.8 Source: TNS Media Intelligence
H1 ‘09 -20% -57% -40% -31% All Segments Are In Decline Source: TNS Media Intelligence
Where Did The Money Go? Other 16% Nat’l TV 28% Web 4% Newsp 26% Spot TV 26%
Where Did The Money Go? Other 13% Other 16% Nat’l TV 38% Nat’l TV 28% Web 7% Web 4% Newsp 23% Newsp 26% Spot TV 26% Spot TV 18%
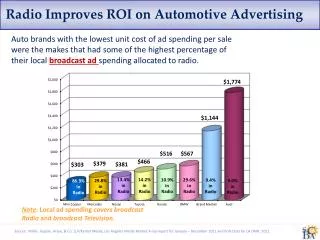
Spot TV Is Losing Share Of Spend… -7.9% +6.4% -9.2% -19.1% $1.72 $5.2 $4.7 $5.1 $4.6 $3.7 -50.5% 24.4% Share 25.5% Share 26.1% Share 27.2% Share 27.7% Share $1.8 18.8% Share Source: TNS Media Intelligence
…As All Segments Pulled Back In H1 ‘09 - $423 million - $303 million - $179 million Source: TNS Media Intelligence
Automotive Cutbacks On Spot TVH1 2009 vs H1 2008 -27% -$26 -68% -$82 -42% -$21 -52% -$77 -70% -$55 -52% -$66 Source: TNS Media Intelligence
-27% -68% -42% -52% -70% -52% Automotive Cutbacks On Spot TVH1 2009 vs H1 2008 Source: TNS Media Intelligence
Large Markets Have Suffered The Most Source: TNS Media Intelligence
Cash For Clunkers Program Source: TNS Media Intelligence
Key Indicators To Track New vehicle sales
Key Indicators To Track New vehicle sales Model introductions and redesigns
Key Indicators To Track New vehicle sales Model introductions and redesigns Ad spend per vehicle sold
Ad Spend vs. Unit Sales Sources: TNS Media Intelligence; Wards AutoInfo Bank
Key Indicators To Track • New vehicle sales • Model introductions and redesigns • Ad spend per vehicle sold • Dealership closings (GM, Chrysler)