Download
1 / 21
210 likes | 346 Vues
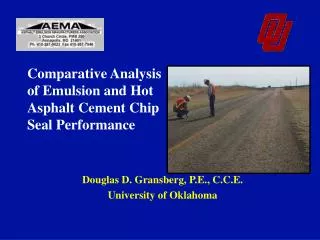
Comparative Analysis of Emulsion and Hot Asphalt Cement Chip Seal Performance. Douglas D. Gransberg, P.E., C.C.E. University of Oklahoma. Project Facts. TxDOT Atlanta District 342 projects All built since 1996 Same seal coat contractor Same TxDOT Area Office

E N D
Comparative Analysis of Emulsion and Hot Asphalt Cement Chip Seal Performance Douglas D. Gransberg, P.E., C.C.E. University of Oklahoma
Project Facts • TxDOT Atlanta District • 342 projects • All built since 1996 • Same seal coat contractor • Same TxDOT Area Office did design/ construction administration • Same aggregate • Same asphalt supplier • 165 used CRS-2P no precoat • 177 used AC15-5TR with precoat
Use of Emulsion as Binder CRS-2H HFRS-2P HFRS CRS-2 CRS-2P 0 2 4 6 8 10 12 No. of Districts Emulsion Binder Usage in Texas
Use of Asphalt Cement as Binder AC 10-latex AC 5-latex AC 10 AC 5 AC15-5TR AC 15P 0 2 4 6 8 10 12 14 16 18 20 No. of Districts Hot AC Binder Usage in Texas
Chip Seal Strategies • Two schools of thought in Texas • Seal as many miles of road as budget will permit: use less expensive system • Make every sealed mile as good as possible: use system with best performance. • Perception is that AC15-5TR yields a better performance. • Atlanta District policy to use AC15-5TR on higher volume roads and CRS-2P on lower volume roads.
Type of binder Type of aggregate Specifications for emulsion and asphalt cement Average rate shot in the main lanes Specifications for aggregate Year of installation Contract requirements Contract amount Amount of material used Location of project Length in feet and miles Area of main lanes shot Area of intersections & miscellaneous locations shot Average daily traffic Visible pavement distresses Project Data Points
Type of underlying pavement % deep and shallow rutting Patching percent % Base failure % Block cracking % Alligator cracking % Longitudinal cracking % Transverse cracking % Raveling (Shelling) % Flushing Average 18 kip wheel loads Average annual maintenance cost Date of last surface Distress score Ride score Surface index Skid number Pavement condition score PMIS Database Data Points
Project Performance Metrics • 27 Discreet Metrics • Average High Flushing Score, • Average Low Flushing Score, and • Project Average Flushing Score, • Average Cost of Binder, • Average Cost of Aggregate, • Average Number of Square Yards on Main Lane, Etc. • Weighted Average Metrics • Square yard weighted average of the pavement condition score • Square yard weighted average of the skid number
Project Performance Metrics • Cost Index Number Metrics • Measure “bang for the buck.” • Combines engineering property with cost property. • Pavement Condition Cost Index • Compare binders ability to maintain pavement condition at an acceptable price • Skid Number Cost Index • Compare binders ability to maintain friction course at an acceptable price
Pavement Condition Cost Index PCCIi = Tci. PCCIB = 3 PCCIi Ave PCi TPB PCCIi = Pavement Condition Cost Index of Project “i” Ave PCi = Average Pavement Condition Score of Project “i” TCi = Total Cost of Project “i” PCCIB = Pavement Condition Cost Index Binder “B” TPB = Total number of projects using Binder “B”
Skid Number Cost Index SNCIi = TCi SNCIB= 3 SNCIi Ave SNi TPB SNCIi = Skid Number Cost Index of Project “i” Ave SNi= Average Skid Number Score of Project “i” TCi = Total Cost of Project “i” SNCIB = Skid Number Cost Index Binder “B” TPB = Total number of projects using Binder “B”
Underlying Pavement Condition in Study Area Emulsions used on roads with more rutting and lower distress scores.
Raveling (Shelling) and Flushing (Bleeding) in Study Area Rated as: none =0; low = 1; medium = 2; high = 4 Shows both binders are effective & Atlanta District is getting good performance from their seals.
Pavement Condition Analysis Pavement Condition Comparison PCCI = $/Ave Unit of PC • CRS-2P & AC15-5TR roughly equal performance • CRS-2P more cost effective
Pavement Condition Cost Index by Year Pavement Condition Cost Index Comparison by Project Year
Skid Number Analysis Skid Number Comparison SNCI = $/Ave Unit of SN • CRS-2P better skid performance • CRS-2P more cost effective
Conclusions • Emulsion chip seals performed as well as the hot AC seals even though they were applied to roads with poorer underlying condition. • Emulsion chip seals are more cost effective.