1 / 17

Presentation by Dr LW Mngoma

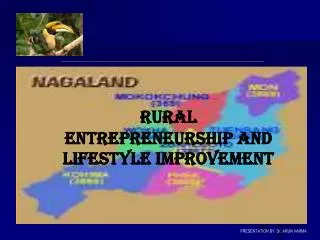
Looking beyond numbers and figures Department of Agriculture. Presentation by Dr LW Mngoma. FIGURE 1: South region. FIGURE 2 Map :uthukela district. FIGURE 3 map: ward 16. TABLE 3: POPULATION BY AGE. Table 4 :Age. Graph : population. Table 4: education. Table 1: ward 16.

ita
Télécharger la présentation

Presentation by Dr LW Mngoma

An Image/Link below is provided (as is) to download presentation Download Policy: Content on the Website is provided to you AS IS for your information and personal use and may not be sold / licensed / shared on other websites without getting consent from its author. Content is provided to you AS IS for your information and personal use only. Download presentation by click this link. While downloading, if for some reason you are not able to download a presentation, the publisher may have deleted the file from their server. During download, if you can't get a presentation, the file might be deleted by the publisher.

E N D

Presentation Transcript


  1. Looking beyond numbers and figures Department of Agriculture Presentation by Dr LW Mngoma

  2. FIGURE 1: South region

  3. FIGURE 2 Map :uthukela district

  4. FIGURE 3 map: ward 16

  5. TABLE 3: POPULATION BY AGE

  6. Table 4 :Age

  7. Graph : population

  8. Table 4: education

  9. Table 1: ward 16

  10. Table 1 further explained

  11. Table 2 : Percentage

  12. Table 5: Employment sector(males)

  13. Table 5: Employment sector(females)

  14. Graph: sector

  15. Graph: gender

  16. Drawing on the energies of the people of this country Building capabilities Enhancing the capacity of the state Promoting leadership and partnerships throughout society. WE CAN ACHIEVE THIS BY

  17. THANK YOU

More Related