Download
1 / 16
160 likes | 274 Vues
Section 6.5. The Central Limit Theorem. Given. The random variable x has a distribution (which may or may not be normal) with mean and standard deviation . Simple random samples all of the same size n are selected from the population. . Conclusions.

E N D
Section 6.5 The Central Limit Theorem
Given The random variable x has a distribution (which may or may not be normal) with mean and standard deviation . Simple random samples all of the same size n are selected from the population.
Conclusions The distribution of sample means will, as the sample size increases, approach a normal distribution. The mean of all sample means is the population mean . The standard deviation of all sample means is .
Practical Rules Commonly Used For a population with any distribution, if n > 30, then the sample means have an approximately normal distribution. If n ≤ 30and the original population has a normal distribution, then the sample means have an approximately normal distribution. If n ≤ 30and the original distribution does not have a normal distribution then the methods of this section do not apply.
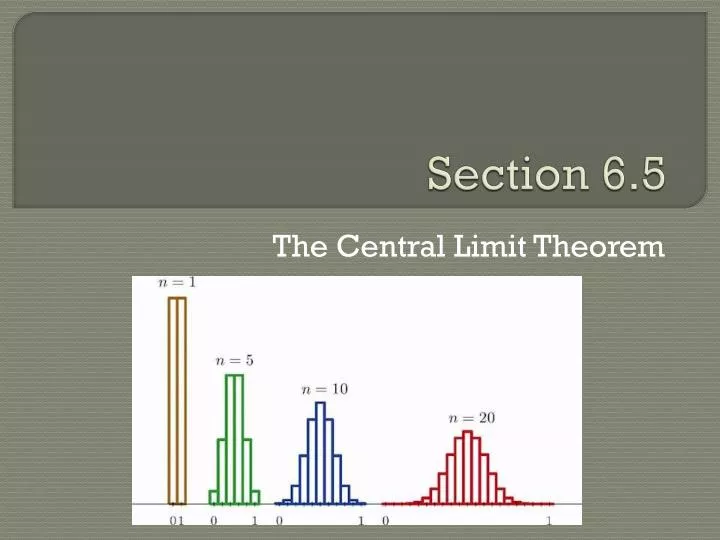
The Central Limit Theorem: In Pictures As the sample size increases, the distribution of sample means approaches a normal distribution.
The Central Limit Theorem: In Pictures As the sample size increases, the distribution of sample means approaches a normal distribution.
Important Points to Note • As the sample size increases, the distribution of sample means tends to approach a normal distribution. • The mean of the sample means is the same as the mean of the original population.
Important Points to Note • As the sample size increases, the width of the graph becomes narrower, showing that the standard deviation of the sample mean becomes smaller.
Cool … So Why Do We Care? • Think of what happens when we have a normal distribution. What can we do? • Table A2 • Calculate any area, therefore any probability. • The central limit theorem shows us that most samples can fit a normal distribution. • So our calculation power (and therefore understanding) is endless!!!
The Fundamental Difference Individual value Sample of values • When working with an individual value from a normally distributed population, use the methods of Section 6.3. • When working with a mean for some sample be sure to use the value of for the standard deviation of the sample mean.
Water Taxi Safety Previously, we talked about the Baltimore water taxi that sank because of old weight limit standards. The water taxi assumed that the average person weight was 140lbs. Given that today the weights of men are normally distributed with a mean of 172 lbs and a standard deviation of 29 lbs. Find the probability that 20 randomly selected menwill have a mean weight that is greater than 175lbs (so that their total weight exceeds the current safe capacity of 3500 lbs).
Water Taxi Safety Previously, we talked about the Baltimore water taxi that sank because of old weight limit standards. The water taxi assumed that the average person weight was 140lbs. Given that today the weights of men are normally distributed with a mean of 172 lbs and a standard deviation of 29 lbs. Find the probability that if an individual man is random selected, his weight will be greater than 175lbs.
Applications What does this mean for our water taxi and their current weight limits?
Reminder!!! The central limit theorem works if the sample size is greater than 30, or if the original population is normally distributed.
Water Taxi Safety Previously, we talked about the Baltimore water taxi that sank because of old weight limit standards. The water taxi assumed that the average person weight was 140lbs. Given that today the weights of men are normally distributed with a mean of 172 lbs and a standard deviation of 29 lbs. Find the probability that 20 randomly selected menwill have a mean weight that is greater than 175lbs (so that their total weight exceeds the current safe capacity of 3500 lbs).
Homework Pg. 295-296 #2, 5-7


![Symmetric supernodes for Cholesky [GLN section 6.5]](https://cdn2.slideserve.com/3794519/symmetric-supernodes-for-cholesky-gln-section-6-5-dt.jpg)