Download
1 / 24
240 likes | 336 Vues
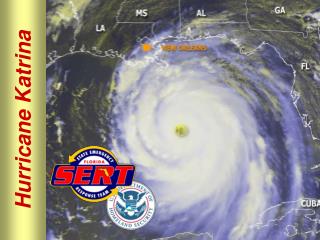
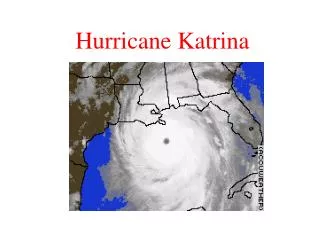
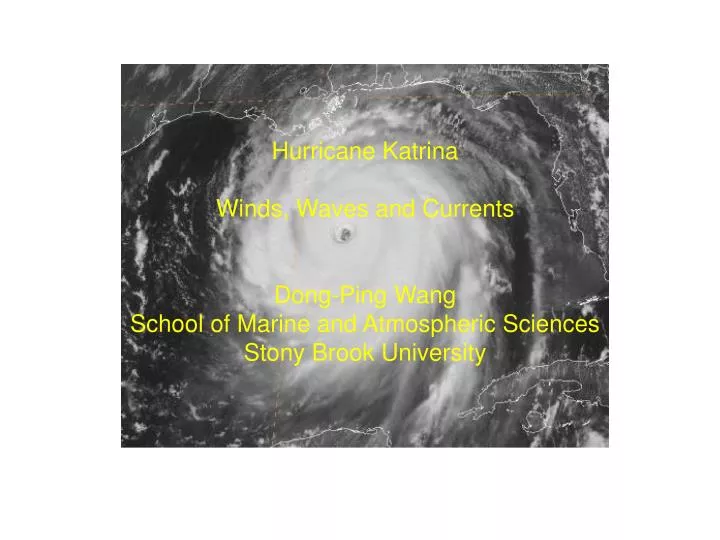
Hurricane Katrina Winds, Waves and Currents Dong-Ping Wang School of Marine and Atmospheric Sciences Stony Brook University. A tempest that may happen only once in a century, created by so rare a combination of factors that it could not possibly have been worse.

E N D
Hurricane Katrina Winds, Waves and Currents Dong-Ping Wang School of Marine and Atmospheric Sciences Stony Brook University
A tempest that may happen only once in a century, created by so rare a combination of factors that it could not possibly have been worse. Sebastian Junger, “The Perfect Storm” Category mph 1 74-95 2 96-110 3 111-130 4 131-155 5 156 > Cat 5
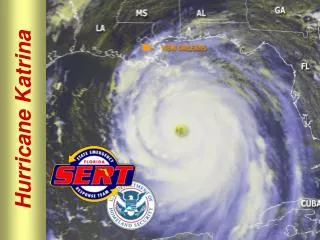
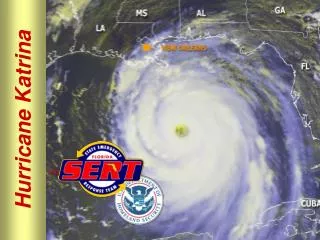
Offshore oil and gas platforms in the Gulf of Mexico must withheld hurricane force winds, waves and currents Katrina Rita
Three NDBC buoys were directly under hurricane force wind – two survived but one capsized Mars platform NDBC buoy
Mars is the most productive oil platform in the Gulf about 150,000 barrels of oil a day
Creating waves ten stories high and winds of 120 mph, the storm whipped the sea to inconceivable levels few people have ever witnessed. 42001 42003 42040 Wind (m/s) highest wave ever recorded Significant wave height (m) August 2005 10 m buoy ever capsized
Blended HRD (Hurricane Research Division) and GFS wind 0600 UTC 28 August 0600 UTC 29 August
One (extraordinary) year of drifter trajectories Gulf Stream Velocity (m/s) Loop Current Caribbean Current
Satellites (Jason-1, GOF, ENVISAT, T/P) provide continuous coverage of sea surface height anomaly sea surface height (cm) warm eddy = deep warm pool
Princeton Gulf of Mexico (western North Atlantic) Model Loop Current sheds off warm eddies every 6-9 months Leo Oey (Princeton University)
Sudden increase of eastward flow plus large inertial oscillations 42003 northward Velocity (m/s) eastward 42001 August 2005
Wind-driven currents generally follow the storm pattern Storm surges
Large inertial currents are excited to the right of storm path
counterclockwise rotating 42001 Wind (m/s) 42040 August 2005 Inertial currents are reinforced by clockwise rotating wind
Wave Watch III with forcing from HRD+GRS wind and ocean currents
Waves are reinforced on the right of storm path 0600 UTC 28 August 0600 UTC 29 August Wave period (s)
Wave model reproduces buoy observations 42001 42003 42040 buoy model Wave height (m) Wave period (s) August 2005
Wave model agrees with altimetry observations slope = 1.12 Altimetry is underestimated altimetry tracks
GFDL hurricane model under-predicts observed (HRD) wind HRD+GFS GFDL
NCEP/NAH analysis under-estimates extreme waves HRD+GFS NAH
Mars was designed to withstand hurricane force waves of 71ft and winds of 140mph, simultaneously On 8/29/04Z significant wave heights would be 66ft and winds 128mph
The wind…keeps increasing until it peaks at 58 knots. The waves are so large that they block the anemometer, and gusts are probably reaching 90 knots. Slope = 0.77 Buoy wind (m/s) HRD wind (m/s)
Scientists understand how waves work, but not exactly how huge ones work wave model Frictional velocity (m/s) GPS sonde observation Wind speed (m/s) Significant wave height ~ (frictional velocity)2
Strong mixing on the right of the storm track is mainly caused by enhanced inertial currents and surface waves Air-sea exchange process under extreme storms is poorly understood Wave model is tuned to observations, but has not been validated for extreme seas To appear in Bulletin of American Meteorological Society