Download
1 / 1
10 likes | 96 Vues
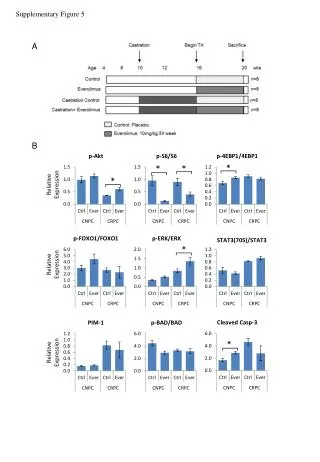
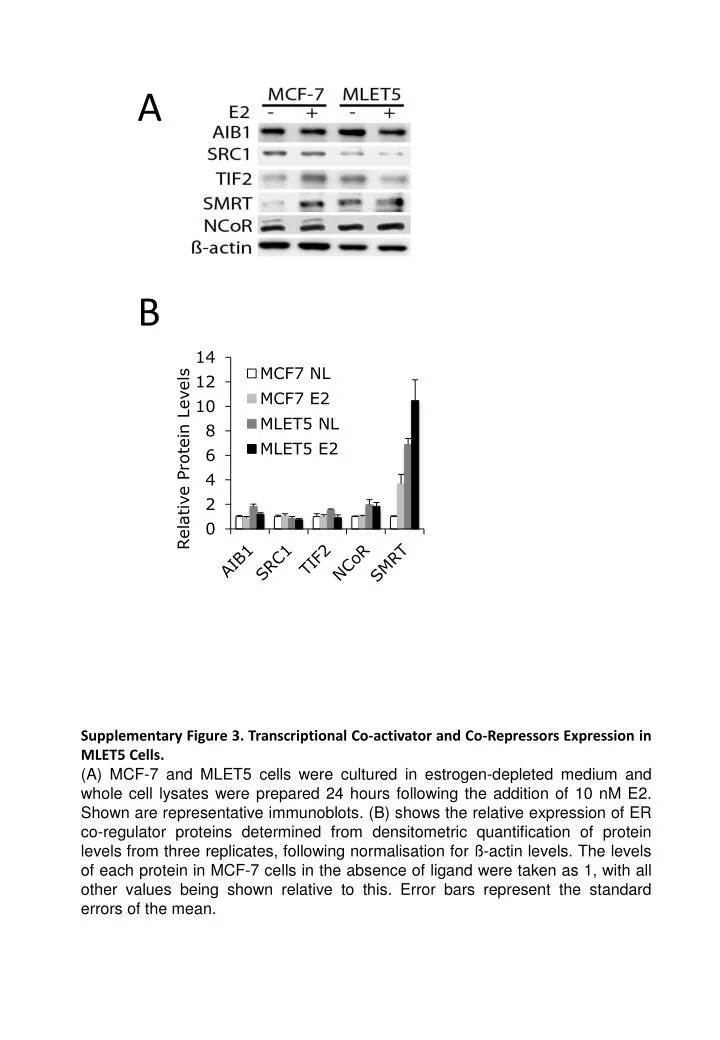
A B. Supplementary Figure 3. Transcriptional Co-activator and Co-Repressors Expression in MLET5 Cells.

E N D
A B Supplementary Figure 3. Transcriptional Co-activator and Co-Repressors Expression in MLET5 Cells. (A) MCF-7 and MLET5 cells were cultured in estrogen-depleted medium and whole cell lysates were prepared 24 hours following the addition of 10 nM E2. Shown are representative immunoblots. (B) shows the relative expression of ER co-regulator proteins determined from densitometric quantification of protein levels from three replicates, following normalisation for ß-actin levels. The levels of each protein in MCF-7 cells in the absence of ligand were taken as 1, with all other values being shown relative to this. Error bars represent the standard errors of the mean.