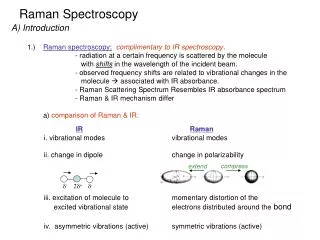
Download
1 / 22
230 likes | 413 Vues
Coherent Raman spectroscopy for the detection of electron spin resonance. Daniel Wolverson Department of Physics University of Bath. Spintronics motivation. Magnetic semiconductors from well-known to highly controversial... CdMnTe (Mg) ZnMnSe (Be,S) GaMnAs (Al) GaMnN

E N D
Coherent Raman spectroscopy for thedetection of electron spin resonance Daniel Wolverson Department of Physics University of Bath
Spintronics motivation • Magnetic semiconductors from well-known to highly controversial... • CdMnTe (Mg) • ZnMnSe (Be,S) • GaMnAs (Al) • GaMnN • Other transition metals besides Mn: • Cr, Co, Fe... dilute magnetic semiconductor (DMS) M Oestreich et al, Appl. Phys. Letts 74 (1999) 1251 (Marburg / Hull) R Fiederling et al, Nature 402 (1999) 787 (Wuerzburg) D Ferrand et al., Sol. St. Commun. 119 (2001) 237 (Grenoble / Wuerzburg / Warsaw)
Coherent Raman ESR Spin Flip Raman Scattering Optical measurement of g factors Electron Spin Resonance (resolution) (sensitivity and resolution) (sensitivity)
SFRS experimental system • resolution limited either by spectrometer or laser; • corresponds to ±0.01 in the g-factor (which is of order 1 to 2 typically); • Fabry-Perot detection and single-frequency dye laser might be a conventional next step.
SFRS Example: electron SFRS of cubic CdSe
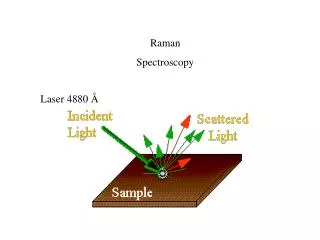
Spin flip Raman introduction • Inelastic light scattering via spin flip; • “Sidebands” are produced shifted up and down in energy with respect to the laser line; a Zeeman splitting is measured. • Spin relaxation lifetimes, band non-parabolicity effects, constraints on momentum transfer of free carriers, and even collective 2DEG excitations in QWs can all modify SFRS energy or linewidth • SFRS is strongly resonant at free or bound exciton transition energies.
Spin flip Raman spectra • Electron SFRS seen in modulation-doped 15nm layers of ZnMnSe; • Transitions between Mn2+ 3d levels (PMR) also seen (g=2.0); • Electron SFRS Raman shift follows Brillouin function of field; • Doping levels from 109 to 3 x 1011 cm-2 were studied. • Bulk-like layers with 1015 < n < 1019 cm-3 were also studied.
Electron SFRS in Cd1-xMnxTe • Nominal x = 0.005 (0.5%). • SFRS measures CB splitting only (in contrast to PL, PLE, reflectivity). No VB or diamagnetic effects. • CB splitting here follows a Brillouin function. • Fitting yields effective x, electron temperature (and, in general, bound magnetic polaron energy). • Mn2+ 3d5 has pure spin S=5/2, g-factor = 2.00; Dms=±1 signal also well-known in SFRS.
CRESR What is CRESR? • At spin resonance, the microwave field B1 induces the precession of the magnetization about the static magnetic field B0; • The component of the magnetization along the laser beam direction oscillates in sign; • The circular dichroism (circularly polarized absorption) oscillates; • The transmitted beam is modulated at the precession frequency (in the microwave region). Magnetic field B0 Microwave magnetic field B1 Laser, RCP / LCP
Experimental setup for CRESR • Laser beam passes through or reflects from sample and onto a fast photodiode; • At resonance, microwaves induce coherence between the two spin states; • The Raman scattered beam propagates co-linearly with laser beam; • These mix on the photodiode to produce a microwave signal; optical heterodyne detection. Magnetic Field Specimen Raman Laser Fast photo-detector Microwaves dc Microwavemixer Microwave source
f2 f2 - f1 f1 Why optical heterodyne detection? • High (near single photon) sensitivity for coherent optical signals; • Blind to broadband incoherent backgrounds (i.e. luminescence); • Allows both amplitude and phase measurements of the optical signal; • Highly efficient detectors with bandwidths of several hundred GHz have now been developed.
Our first semiconductor CRESR • ZnSe: single resonance seen near 0.88 Tesla • g-factor is 1.1162 • Precision: 0.0001 • Accuracy: 0.001 • Comparison of energy scales between CRESR and SFRS (inset) shows CRESR has very much higher resolution. S. J. Bingham, J. J. Davies and D. Wolverson, Phys. Rev. B 65 155301 (2002)
CRESR dependence on excitation energy SFRS • Excitation profiles of SFRS and CRESR are similar; • PL spectra of the donor-bound exciton show the effects of changing the strain state: a: strained to substrate; b: free-standing ZnSe; c: ZnSe attached to silica. CRESR c a b
CRESR applied to heterostructures • ZnSe on GaAs (reflection geometry; substrate now not removed) • Complex lineshape may indicate more than one shallow donor species • ZnSe quantum well in ZnBeMgSe barriers • Detectable signal from a single quantum well
CRESR of bulk Cd1-xMnxTe (i) • First application to a magnetic semiconductor; • Archetypical CdMnTe chosen; • Magnetic field swept through microwave (spin) resonance condition for a laser energy in the exciton region; • Internal Dms=±1 transition of Mn2+ ions is seen, as noted in our SFRS spectra earlier, at B ~ 0.48T for 13.7GHz; • Lineshape results from hyperfine interaction with Mn I=5/2 nucleus (bars on figure) • Dispersion- and absorption-like components shown.
Vertical: meV Horiz.: Tesla Dots: CB Lines: VB T0 = 0.3K Effective x is 0.0048 CB and VB splittings, Cd0.995Mn0.005Te
Excitation energy dependence • Laser energy swept through optical resonance condition for a set of magnetic fields near the g=2.00 spin resonance field (0.49T); • Compare structure seen to the predicted exciton energies (which are also measured via PLE); • lh, hh degenerate in bulk, therefore 8 transitions (S=1/2 J=3/2); • Exciton electron-hole exchange and diamagnetic shift taken into account.
Simulation of CRESR • On wider magnetic field scale, see a second broad signal; • Is it CB electron spin flip? • Can simulate data with • set of usual ESR lineshapes at Mn2+ g=2.00 line (including hyperfine interaction with Mn nucleus) and • one line at the position of the broad signal. • So far, consistent with electron spin flip Raman.
CRESR of bulk Cd1-xMnxTe (ii) • Magnetic field swept through microwave (spin) resonance condition for a set of laser energies in exciton region; • Internal Dms=±1 transition of Mn2+ ions seen at B ~ 0.5T (centre of figure), independent of optical excitation energy • Broad signal has “g-factor” dependent on excitation energy (!) • CB electron SFRSor optical detuning effect?
Excitation-energy dependent broad peak • Positions of broad signalmarked by ; • Do not observe a signal at field corresponding to spin resonance condition for CB electrons; • The microwave frequency (13.7 GHz)is too low for this (35 GHz available); • Symmetrical shift to higher field with detuning from resonance follows the outer exciton energy levels (red).
Summary • First application of CRESR technique to a dilute magnetic semiconductor demonstrates feasibility, high sensitivity, high resolution and shows expected signals for a simple bulk sample; • New features also seen: Mn hyperfine structure, complex resonance behaviour; • Extension to multiple Mn2+ signals with |Dms|>1 planned; • First results on GaMnAs also obtained (not presented) and are completely different… Funding EPSRC, DFG, INTAS
Lowenna Glover Dr. Stephen Bingham Prof. J. John Davies Shanshan Zeng Dr. Gazi Aliev Dr David Richards, KCL. Prof. Jean Geurts and Prof. Laurens Molenkamp, Würzburg. Dr. Richard Harley, Southampton. U. Bremen CEA-Grenoble Heriot-Watt U. A.F. Ioffe Institute U. Lecce Philipps-U. Marburg U. Nottingham Polish Acad. Sci., Warsaw U. Würzburg Team and collaborators