Download
1 / 4
40 likes | 161 Vues
Water Management Presentations Summary. Determine climate and weather extremes that are crucial in resource management and policy making Precipitation extremes Snowpack amounts and melt timing Floods and increased maximum streamflow anomalies Increased source water temperature

E N D
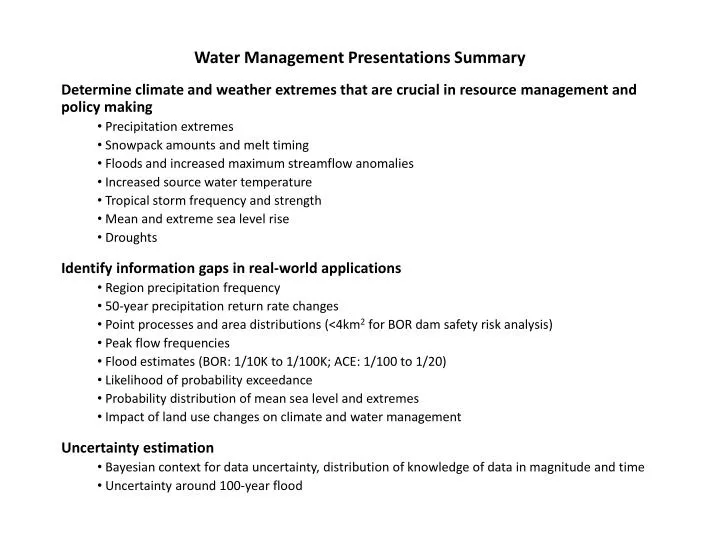
Water Management Presentations Summary Determine climate and weather extremes that are crucial in resource management and policy making Precipitation extremes Snowpack amounts and melt timing Floods and increased maximum streamflow anomalies Increased source water temperature Tropical storm frequency and strength Mean and extreme sea level rise Droughts Identify information gaps in real‐world applications Region precipitation frequency 50-year precipitation return rate changes Point processes and area distributions (<4km2 for BOR dam safety risk analysis) Peak flow frequencies Flood estimates (BOR: 1/10K to 1/100K; ACE: 1/100 to 1/20) Likelihood of probability exceedance Probability distribution of mean sea level and extremes Impact of land use changes on climate and water management Uncertainty estimation Bayesian context for data uncertainty, distribution of knowledge of data in magnitude and time Uncertainty around 100-year flood
Water Management Panel Discussion Summary What would be ideal product for making good decisions? Frequency curve changes and return levels with confidence bands Changes in upstream flows and changes in sea level rise using joint probability approaches Use of ensembles showing streamflow changes with time Information on state changes Users would like to check skill of models for projecting extremes; have a model “culling” based on skill assessment; provide uncertainty bands; use uncertainty info for decision making. How is information from climate projections used? BOR report on use of climate information; Report by Brekke et al. 2011 provides long term (20-year) planning document and short term document (in development) Operational level is reactionary. Suggest case approach for examining potential decisions based on using climate model projections. Consider how NYC/NJ would redesign based on projected sea level rise: design plans based on 2m by 2100 are not considering future sea level increases beyond 2100. For California climate change impact on water resources, we don’t have much progress of water quantity impact because of challenge in using statistical downscaling. Advantage of dynamic downscaling for needed daily precipitation and temperature. How do reservoir operators respond to incorrect predictions? How does quality of output impact operations? Operators are risk averse, decisions not made until water hits ground Making headway on dynamic pools based on flood potential
Water Management Panel Discussion Summary (cont) Are there competing constituency demands? Yes, often resulting in decreasing outcomes for all parties. Decisions can compensate losers to ease tensions when making decisions. For example, reservoir design based on 98%ile (for irrigation), for 95%ile would need only 50% of design. Could buy way out with insurance. Example of compensation in event reservation pool is not refilled (Sacramento case) What models should be used? Interpolation vs Extrapolation? Use empirical distributions, do not use analytical fit. Difficulty in extrapolation. Don’t have sufficient number of basins for extrapolating. Use hypothetical events to produce hydrographs at 200-, 500-year events. Gives homogeneous data set. How does one make a decision on something so small as a 1/10K event with large uncertainty? We can’t ground-truth freq curves at 100yr, so we don’t have evidence to base changes in decision What is the potential for cross-validation? Need to be aware that as you are fitting, are not satisfying when using small samples Can verify on lower quantiles Need simulation/Monte Carlo analysis; Need more members in ensembles. How ready are we to do away with corrections? Benefit of leapfrogging rather than using weather generators Variables are different at different timescales (e.g. at 20-25 years out, need shift in probability distribution)
Water Management Panel Discussion Summary (cont) Is there value in using the operational seasonal forecasts over 15 years? It would be helpful to check reliability of seasonal forecasts and then look at decision making over same period. How does one trade off loss of life? Challenging question; difficult to address. Do we have systems in place to produce information that can be used? How do we get the climate projections of larger features to do trend analyses? What drives the high variability on decadal timescales? How are land use changes being utilized? Looking at projections through 2100, is it possible to employ a different approach running for stationary state and then at 2050 run at different stationary state? For projection of precipitation increase over PNW, what form do you need uncertainty? How will uncertainty information be used to achieve the best decision?