1 / 0

Water Power Peer Review

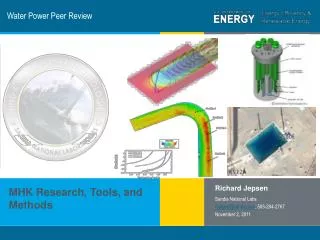
Water Power Peer Review. 4.1.3 Environmental Flows. Environmental Hurdles for Conventional Hydropower: Tools and Method Development for Environmental Flows Determination Dr. Mark Bevelhimer – Oak Ridge National Laboratory Dr. Tim Hanrahan – Pacific Northwest National Laboratory

ivrit
Télécharger la présentation

Water Power Peer Review

An Image/Link below is provided (as is) to download presentation Download Policy: Content on the Website is provided to you AS IS for your information and personal use and may not be sold / licensed / shared on other websites without getting consent from its author. Content is provided to you AS IS for your information and personal use only. Download presentation by click this link. While downloading, if for some reason you are not able to download a presentation, the publisher may have deleted the file from their server. During download, if you can't get a presentation, the file might be deleted by the publisher.

E N D

Presentation Transcript


  1. Water Power Peer Review

    4.1.3 Environmental Flows Environmental Hurdles for Conventional Hydropower: Tools and Method Development for Environmental Flows Determination Dr. Mark Bevelhimer – Oak Ridge National Laboratory Dr. Tim Hanrahan – Pacific Northwest National Laboratory Dr. John Hayse – Argonne National Laboratory Dr. Ben O’Connor – Argonne National Laboratory Mark Bevelhimer Oak Ridge National Laboratory bevelhimerms@ornl.gov 865-576-0266 November 4, 2011 4.1 Environmental Performance and Siting
  2. Purpose, Objectives, & Integration Hydrology Biology Connectivity Water quality Geomorphology Hourly Daily Seasonal Challenges Selection of appropriate environmental flows is difficult and contentious. Because of complexity and lack of tools to handle complexity, the ‘natural flow paradigm’ is often the basis for flow prescriptions (i.e., more natural equates to healthier system… but not necessarily the case) Move toward ROR operations from peaking removes the flexibility that provides much of the value of hydropower. Questions: How do we best manage peaking operations to minimize environmental impact? What aspects of peaking are contrary to a healthy stream ecosystem AND which are not? What is it about some peaking projects that support healthy fish populations and aquatic ecosystems? Emphasis of this project
  3. Purpose, Objectives, & Integration Objectives Assess industry needs for addressing environmental flow issues at hydropower projects. [COMPLETED] Develop an analytical approach to characterizing sub-daily flow characteristics to better assess their relationship with stream health and environmental services.. Provide information that can be used to support flexible hydropower operations Guidance for the development of sub-daily flow targets and project operation Relevance to DOE Program Objectives To improve the efficiency, flexibility, and environmental performance of conventional hydropower generation Preserving peaking as a viable means of operation maintains the load-following benefits of CH. Identification of relationship between hydropower operation and environmental health will aid in successful licensing of new and existing projects. Task Integration With CH_TD #3.3.1 Hydropower Optimization Toolbox - The instream flows tools and analytical approach for the instream flows project will be used to provide insight on the effects that hydropower peaking has had on sub-daily flows for case study sites. The instream flows analytical tools will be used to see how subdaily metrics would change under different types of operations being considered to optimize power production and environmental performance. Applying NHAAP database in peaking analysis and providing additional attributes to the NHAAP
  4. Technical Approach National classification of rivers by flow National characterization of peaking projects Combined operational-hydrological classification of peaking projects Regional or basin level characterization of sub-daily flow Geomorphological context to peaking flows Biological response to peaking flows Guidance for development of sub-daily flow targets and project operation
  5. Technical Approach Task 1 - Tool Development: Because the impact of within-day (or sub-daily) flow variation is largely unsettled, most of the tools we are developing address the characterization, investigation, and mitigation of daily peaking hydropower operations. Sub-daily flow metrics – Summarize existing and develop new flow metrics appropriate for sub-daily flows. River classification tool - Application of geomorphic analysis of rivers that includes the hierarchical structure of river systems, This is because watershed-scale physical characteristics provide the template and constraints within which point-scale characteristics develop. Database/bibliography of ecological responses to sub-daily flow variation – Analysis of ecological response relationships along gradients of hydrological alteration for the biological communities and processes of river ecosystems. Task 2 - Peaking Operation Flow Analyses: We will be using existing tools and databases (i.e., ORNL’s NHAAP) to analyze the prevalence of various flow-related issues as a result of peaking hydropower operations. : National analysis of peaking project distribution, size, hydrograph impact, etc. Mitigation potential of re-regulating dams and other approaches for addressing peaking issues. Task 3 – Basin Scale Case Studies: The tools and methods developed in Tasks 1 and 2 will be used for specific projects to demonstrate their utility. Upper Tennessee River Upper Colorado River/Gunnison River (flow optimization project) Feather River Basin (flow optimization project)
  6. Technical Approach Key issues What characteristics of flow are most important environmentally and economically? How can we better measure and link biological response to river flow regime? How can uncertainty in environmental flow benefits be reduced so that costs of environmental flows can be better justified? How can we get more information out of existing hydrological and biological data by using regional and basin-scale analyses? Unique aspects of approach Incorporating finer resolution temporal scale in hydrologic analysis Consideration of more holistic approaches (multi-species, community and ecosystem responses) Using larger spatial scale to address site-specific issues (basin-scale and regional approaches.
  7. Plan, Schedule, & Budget Schedule Initiation date: Oct 1, 2009 Planned completion date: Sept 30, 2012 FY10 milestones: Annual report, Sept 30, 2010 FY11 milestones: Q2. White paper describing choice of hydro-relevant flow metrics and development of new hourly flow metrics. Q3. Completed preliminary screening to identify hydropower projects that were operated in a peaking mode and had a nearby downstream gage that collected data on at least an hour frequency. Q3. Disseminate results of 2010 environmental flow survey through conference presentations and mailings. Q3. Completed a preliminary analysis of sub-daily water temperature metrics. Q4. Organized and conducted a symposium on Environmental Flow Applications in the Management of Hydroelectric Dams at national conference. Q4. Annual Status Report Budget: No variances in proposed budget $68K carryover to FY12 (3 labs combined) Annual budget split evenly among ORNL, ANL, and PNNL
  8. Accomplishments and Results FY 2010 Developed and conducted instream flow research needs survey. Completed literature review of statistical methods for describing flow regimes Participated in USFWS/TNC training workshop on use of Indicators of Hydrologic Alteration software Conducted review of papers of various flow assessment methodologies Identified additional steps and analyses needed to make ELOHA framework more hydropower relevant. Identified and evaluated analytical approaches that stakeholders can use to characterize flow regimes in order to better assess the ability to provide efficient power and environmental services. Information Dissemination: Hydropower Mitigation Workshop, Washington, DC American Fisheries Society annual meeting, Pittsburgh
  9. Accomplishments and Results FY 2011 Tool Development: Completed research needs survey with additional responses from utility representatives. Survey responses highlighted several research needs [See slide 9] Completed analysis of sub-daily flow metrics, including those proposed by others and those we developed. This analysis was presented in a white paper and is being prepared for submission to a peer-reviewed journal. (Milestone) [See slides 10-11] Created spreadsheet tool that calculates sub-daily flow metrics and produces summary figures from 1 year of 15-min USGS flow data Completed a preliminary analysis of sub-daily water temperature metrics to complement flow metrics. To evaluate flow variability across a broad spectrum of hydropower facility types and operational considerations, we conducted a preliminary screening to identify hydropower projects for future evaluation that were operated in a peaking mode and had a nearby downstream gage that collected data on at least an hour frequency. (Milestone) Basin-Scale Case Studies: Our third area of study for FY11 was to develop methods and tools for developing basin- or region-wide approaches for determining environmental flows for streams that are affected by the operation of hydropower projects. We participated in two projects that included analyses of the effects of project operations and resulting flows on fish habitat. Complete manuscript on study to determine if hydroelectric dam operations could be modified, within existing system constraints (e.g., minimum to normal pool levels; without partial removal of a dam structure), to increase the amount of available fall Chinook salmon spawning habitat in the lower Snake River
  10. Accomplishments and Results Research Needs Survey Summary better information on the relationships between various components of flow and biological response more biological data on habitat requirements of aquatic biota, more holistic flow models, basin and region scale approaches, better validation and verification of existing methods, and better processes and approaches that incorporate existing methods.
  11. Accomplishments and Results Sub-Daily Flow Metrics Hourly minimum – lowest measured flow during a 24-hr period Hourly maximum – highest measured flow during a 24-hr period Daily range – difference between daily minimum and daily maximum Daily range as a percentage of total daily flow Maximum hourly (or 15-min) ramping rate – greatest change between any two consecutive flow measurements Reversals – number of changes between rising and falling periods of the hydrograph Rise and Fall Counts – Number of time periods (15 min or 1 hr) of rising or falling flow Coefficient of Diel Variation – standard deviation of hourly flows divided by mean 24-hr flow Richards-Baker Flashiness Index – the pathlength of flow oscillations (sum of the absolute values of hour-to-hour changes in hourly flows) divided by the sum of hourly flows Hydrograph (15-minute flows) of Baker River at Concrete, Washington from USGS gage 12193500, January-October 1990.
  12. Accomplishments and Results Examples of Sub-Daily Flow Metrics Daily relative range of flow for the Baker River, WA Number of flow reversals for the Baker River, WA Richards-Baker flashiness index for the Baker River, WA
  13. Accomplishments and Results Annual Frequency Histograms for Select Flow Metrics Certain classes of streams are likely to share many sub-daily flow patterns. Under both regulated and unregulated conditions many of these metrics sometimes vary seasonally in predictable ways either as a result of natural variation in flow and water availability and in combination with hydropower demands and project operations. To demonstrate how sub-daily flow metrics vary among a variety of stream types (i.e., with and without hydro, high and low average flow, etc.), we evaluated a year of 15-min flow data for nine streams from across the US.
  14. Accomplishments and Results Annual Frequency Histograms for Select Flow Metrics In FY12 these types of analyses will be used to characterize the range in sub-daily flow variation within and among different classes of streams. We will evaluate correlations among these values and various measures of fish community health and stream health.
  15. Accomplishments and Results FY 2011 Information Dissemination: Reports and Publications “Metrics for Characterizing Subdaily Stream Flow Variation” - Whitepaper submitted to DOE-EERE on March 31, 2011. Being developed further for journal submission. (Authors: Bevelhimer and O’Connner) “Environmental Flow Information and Research Needs Assessment” - Whitepaper submitted to DOE-EERE on May 30, 2011. (Authors: Bevelhimer, Hanrahan, and Hayse). Distributed final report to 200+ instream flow practitioners. (Milestone) “Site Selection Summary: Evaluating Environmental Flows Downstream of Hydroelectric Facilities with a Focus on Operation Shifts from Peaking to Run-of-River” - Whitepaper submitted to DOE-EERE on July 1, 2011. (Authors: O’Connner and Hayse) “Effects of Hydroelectric Dam Operations on the Restoration Potential of Snake River Fall Chinook Salmon (Oncorhynchus tshawytscha) Spawning Habitat” - Prepared for journal submission. (Authors: Hanrahan and Richmond) “Channel morphology and hydraulic characteristics of the lower Snake River prior to impoundment” - Prepared for journal submission. (Authors: Hanrahan, Neitzel, and Richmond) Conference Attendance and Presentations Invited presentation titled “Challenges in Assessing Flow Mitigation Effectiveness“ at the National Hydropower Association Northeast Regional Meeting – Manchester, NH, November 16, 2010. (Bevelhimer) Invited presentation titled “Common Problems with Adaptive Management” as part of panel: Using the Adaptive Management Tool: What Works?, National Hydropower Association Annual Conference, Washington, DC, April 4-6, 2011. (Bevelhimer) Invited presentation titled “Quantifying Large River Restoration Potential Through Modeling and Geomorphic Analysis” at the International Conference on the Status and Future of the World's Large Rivers, Vienna, Austria, 11-14 April 2011. (Hanrahan) Invited presentation titled “Environmental Flows and Riverine Habitats: Examples of Hydraulic and Geomorphic Interactions” at University of Illinois, Environmental Hydrology and Hydraulic Engineering Seminar Series, April 15, 2011. (O’Conner) Poster presentation titled “Environmental Flows at Hydropower Projects: Knowledge Gaps and Research Needs as Identified in an Industry-wide Survey” at FLOW 2011 in Nashville, TN, May 2011. (Bevelhimer, Hanrahan, Hayse) Invited presentation titled “Assessing the Effectiveness of Instream Flow Mitigation“ at Session 2F: Making Sure Your U.S. FERC License Yields the Desired Results, Hydrovision International, Sacramento, CA, July 19-22, 2011. (Bevelhimer) The ANL/ORNL/PNNL team organized and conducted a symposium titled “Environmental Flow Applications in the Management of Hydroelectric Dams: Science, Policy, And Management” at the 2011 American Fisheries Society Annual Meeting, 4-8 September 2011.
  16. Challenges to Date Additional staff needed that can concentrate nearly full time on this task. New post-doc has been hired at ORNL with extensive experience on regional assessment of instream flow and the effects of hydropower operations on stream form and function. Nationwide information on project modes of operation is not compiled anywhere. We will be seeking this out from FERC and other sources and developing methods to estimate operations.
  17. Next Steps Project plans for FY12 in three areas (Tool Development, Peaking Operation Flow Analyses, and Basin-scale Case Studies) is described in Technical Approach on slide 4. FY12 Milestones: Q1: ORNL-Complete national analysis of peaking operations (number of projects, amount of daily flow variation, etc.) and possible mitigation opportunity using ORNL’s NHAAP database. ANL-Complete white paper summarizing and comparing downstream extent of flow variability and geomorphic metrics under hydropeaking and run-of-the-river operations PNNL-Complete literature review of river classification systems to identify current state of science. Q2: ORNL/ANL-Summarize broad analysis of sub-daily flow metrics in a manuscript for journal submission. PNNL-Summarize broad analysis of sub-daily temperature metrics in a manuscript for journal submission. Q3: ORNL-Compile bibliography with summary on the effects of sub-daily flow variation on ecological resources. ANL-Complete evaluation of the downstream extent of hydropower influence on variability in flow characteristics. PNNL-Complete development of a river classification system. Q4: ORNL-Deliver end of project report to DOE that describes 1) our analysis of sub-daily peaking flows and related environmental effects, 2) tools for characterizing these flows, and 3) an approach for linking these tools and analyses to flow mitigation. ANL-Deliver end of project report to DOE that describes 1) our analysis of the extent of downstream propagation of sub-daily flow variability as a function of hydropower operations, and 2) tool developed for characterizing sub-daily flow metrics. PNNL-Deliver end of project report to DOE
  18. Next Steps Next steps (beyond FY2012): By the end of this year we will have completed some regional analyses of the relationship between sub-daily flow variation and various measures of stream ecological health. Follow-up studies that are needed to increase our understanding of ways that hydropower peaking operations can co-exist with healthy aquatic communities include: More comprehensive assessment of distribution and extent of peaking/load-following operations across the US National river classification based on multi-variate analysis of seasonal, weekly, daily, and hourly flow metrics. National geomorphic classification of rivers Comprehensive analysis of the effects of environmental regulations on flow optimization during peaking operations
More Related