Download
1 / 1
10 likes | 84 Vues
Diffusion Tensor Magnetic Resonance Tractography of the Prostate: Feasibility for Mapping Periprostatic Neurovascular Anatomy

E N D
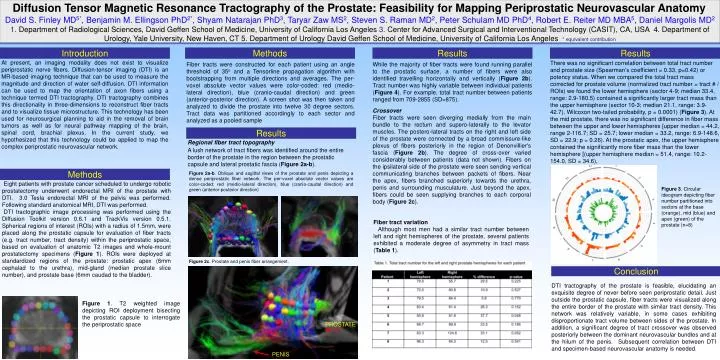
Diffusion Tensor Magnetic Resonance Tractography of the Prostate: Feasibility for Mapping Periprostatic Neurovascular Anatomy David S. Finley MD5*, Benjamin M. Ellingson PhD2*, Shyam Natarajan PhD3, Taryar Zaw MS2, Steven S. Raman MD2, Peter Schulam MD PhD4, Robert E. Reiter MD MBA5, Daniel Margolis MD2 1.Department of Radiological Sciences, David Geffen School of Medicine, University of California Los Angeles 3. Center for Advanced Surgical and Interventional Technology (CASIT), CA, USA 4. Department of Urology, Yale University, New Haven, CT 5. Department of Urology David Geffen School of Medicine, University of California Los Angeles* equivalent contribution Introduction Methods Results Results Fiber tracts were constructed for each patient using an angle threshold of 35o and a Tensorline propagation algorithm with bootstrapping from multiple directions and averages.The per-voxel absolute vector values were color-coded: red (medio-lateral direction), blue (cranio-caudal direction) and green (anterior-posterior direction). A screen shot was then taken and analyzed to divide the prostate into twelve 30 degree sectors. Tract data was partitioned accordingly to each sector and analyzed as a pooled sample At present, an imaging modality does not exist to visualize periprostatic nerve fibers. Diffusion-tensor imaging (DTI) is an MR-based imaging technique that can be used to measure the magnitude and direction of water self-diffusion. DTI information can be used to map the orientation of axon fibers using a technique termed DTI tractography. DTI tractography combines this directionality in three-dimensions to reconstruct fiber tracts and to visualize tissue microstructure. This technology has been used for neurosurgical planning to aid in the removal of brain tumors as well as for neural pathway mapping of the brain, spinal cord, brachial plexus. In the current study, we hypothesized that this technology could be applied to map the complex periprostatic neurovascular network. There was no significant correlation between total tract number and prostate size (Spearman’s coefficient = 0.33, p=0.42) or potency status. When we compared the total tract mass corrected for prostate volume (normalized tract number = tract # / ROIs) we found the lower hemisphere (sector 4-9; median 33.4, range: 2.9-180.5) contained a significantly larger tract mass than the upper hemisphere (sector 10-3; median 21.1, range: 3.9-42.7), Wilcoxon two-tailed probability, p = 0.0001) (Figure 3). At the mid prostate, there was no significant difference in fiber mass between the upper and lower hemispheres [upper median = 44.2, range 2-116.7; SD = 25.7; lower median = 33.2, range: 6.9-148.6, SD = 22.9; p = 0.26). At the prostatic apex, the upper hemisphere contained the significantly more fiber mass than the lower hemisphere [(upper hemisphere median = 51.4, range: 10.2-154.0, SD = 34.6), While the majority of fiber tracts were found running parallel to the prostatic surface, a number of fibers were also identified travelling horizontally and vertically (Figure 2b). Tract number was highly variable between individual patients (Figure 4). For example, total tract number between patients ranged from 709-2855 (SD=875). Crossover Fiber tracts were seen diverging medially from the main bundle to the rectum and supero-laterally to the levator muscles. The postero-lateral tracts on the right and left side of the prostate were connected by a broad commissure-like plexus of fibers posteriorly in the region of Denonvillier's fascia (Figure2b). The degree of cross-over varied considerably between patients (data not shown). Fibers on the ipsilateral side of the prostate were seen sending vertical communicating branches between packets of fibers. Near the apex, fibers branched superiorly towards the urethra, penis and surrounding musculature. Just beyond the apex, fibers could be seen supplying branches to each corporal body (Figure 2c). Results Regional fiber tract topography A lush network of tract fibers was identified around the entire border of the prostate in the region between the prostatic capsule and lateral prostatic fascia (Figure 2a-b). Methods Figure 2a-b. Oblique and sagittal views of the prostate and penis depicting a dense periprostatic fiber network. The per-voxel absolute vector values are color-coded: red (medio-lateral direction), blue (cranio-caudal direction) and green (anterior-posterior direction) Eight patients with prostate cancer scheduled to undergo robotic prostatectomy underwent endorectal MRI of the prostate with DTI. 3.0 Tesla endorectal MRI of the pelvis was performed. Following standard anatomical MRI, DTI was performed. DTI tractographic image processing was performed using the Diffusion Toolkit version 0.6.1 and TrackVis version 0.5.1. Spherical regions of interest (ROIs) with a radius of 1.5mm, were placed along the prostatic capsule for evaluation of fiber tracts (e.g. tract number, tract density) within the periprostatic space, based on evaluation of anatomic T2 images and whole-mount prostatectomy specimens (Figure 1). ROIs were deployed at standardized regions of the prostate: prostatic apex (6mm cephalad to the urethra), mid-gland (median prostate slice number), and prostate base (6mm caudad to the bladder). Figure 3. Circular ideogram depicting fiber number partitioned into sectors at the base (orange), mid (blue) and apex (green) of the prostate (n=8) Fiber tract variation Although most men had a similar tract number between left and right hemispheres of the prostate, several patients exhibited a moderate degree of asymmetry in tract mass (Table 1). Figure 2c. Prostate and penis fiber arrangement. Conclusion DTI tractography of the prostate is feasible, elucidating an exquisite degree of never before seen periprostatic detail. Just outside the prostatic capsule, fiber tracts were visualized along the entire border of the prostate with similar tract density. This network was relatively variable, in some cases exhibiting disproportionate tract volume between sides of the prostate. In addition, a significant degree of tract crossover was observed posteriorly between the dominant neurovascular bundles and at the hilum of the penis. Subsequent correlation between DTI and specimen-based neurovascular anatomy is needed. Figure 1. T2 weighted image depicting ROI deployment bisecting the prostatic capsule to interrogate the periprostatic space PROSTATE PENIS