Download
1 / 24
240 likes | 359 Vues
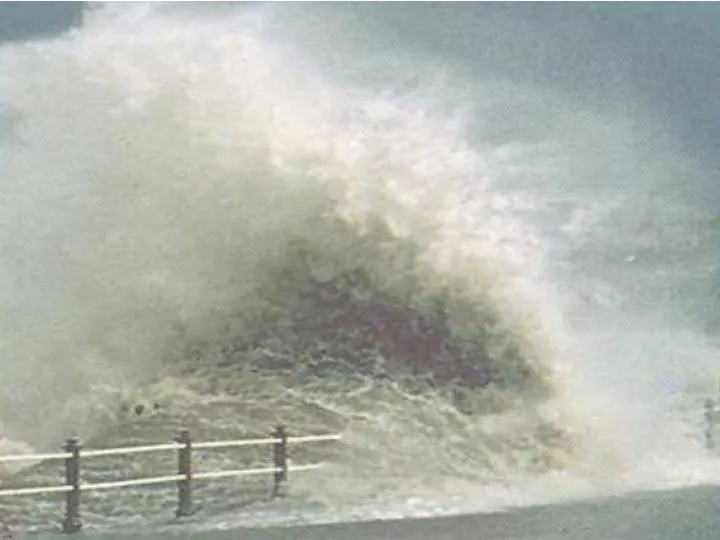
Climate change, hydrodynamical models & extreme sea levels. Adam Butler Janet Heffernan Jonathan Tawn Lancaster University Department of Mathematics & Statistics. The problem. Introduction. Understanding the impacts of climate change upon extreme sea levels .

E N D
Climate change,hydrodynamical models & extreme sea levels Adam Butler Janet Heffernan Jonathan Tawn Lancaster University Department of Mathematics & Statistics
Introduction • Understanding the impacts of climate change upon extreme sea levels. • Understanding spatial variation in impacts. • Use statistical ideas of spatial statistics and extreme value theory (Smith, 2002). • Attempt to build physically realistic models. • Applications: flood defence, offshore engineering, insurance…
POL models < 35km NEAC grid < 12km NISE grid V V
Observed climate inputs • Run using observational climate data. • Model run for period 1970-1999. • Run on NICE and NEAC grids. • Reasonable fit to observational data (Flather, 1987). • Test for evidence for a linear temporal trendin extreme values.
Climate sensitivity Generate 30-year long sequences of model output under two hypothetical climate scenarios: • “Current” CO2 levels • Double “current” CO2 levels • Sequences are stationary. • Climate inputs generated using the ECHAM-4 climate model. • We will construct parametric models. • Interest is in comparing the parameter estimates obtained under the two scenarios.
The GEV distribution • Blockwise maxima converge to a GEV (Generalized Extreme Value) distribution: • is the shape parameter. • Conditions for convergence include: • independence or weak dependence • stationarity (Leadbetter, 1987).
Modelling extremes General ideas • Ignore distribution of original data. • Can model maxima using GEV distribution. • Alternative approaches to extremes exist: e.g. threshold methods (Coles, 2001). Application to the POL data • Model the annual maxima at each site. • Assume independence between sites.
Surge residuals Changes (cm) in 50 year surge levels for the NISE grid. Estimates exhibit spatial variability. Previous findings
Multivariate extremes • Componentwise maxima • Multivariate Extreme Value Distribution • Nonparametric or parametric estimation ? Parametric approaches • Marginal and dependence characteristics. • The Multivariate Logistic Distribution • Alternative parametric models (Tawn, ?) • Physically motivated subsets
Spatial extremes • Assume smooth spatial variation in GEV parameters. • This implies spatial coherence. • Assume that observations at neighbouring sites are spatially dependent. • Use a multivariate approach to extremes, with one dimension for each site. Benefits • Improved efficiency in parameter estimation. • Interpretable estimates of spatial structure. • Allows extrapolation to ungauged sites. • Enables regional-level estimates to be derived.
Marginal or joint estimation? • Bivariate case,GEV margins, logistic dependence. • Three possible methods for estimation: • joint likelihood (“joint”), • product of marginal likelihoods (“marginal”) • robust version of “marginal” approach • Marginal approach results in reduced efficiency if there is dependence. • How large is this effect ? Simulation study. • See: Shi, Smith & Coles (1992), Barao & Tawn (1999).
Conclusions Further work • “Bivariate efficiency” study • Comparison of approaches to spatial extremes • POL data: extremal trends • POL data: climate sensitivity • Scottish rainfall data…? Statistical significance • Application of modern extreme value methods in an applied context • High dimensionality