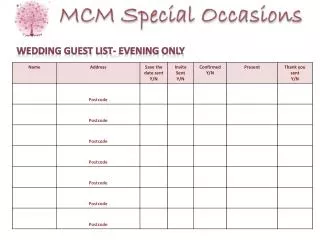
Download
1 / 41
410 likes | 551 Vues
This guide provides an overview of modeling in sports, examples of models used, and resources for sports information. Learn how to create predictive, physical, and fairness models in sports, along with guidelines on the modeling process and write-up essentials.

E N D
MCMModeling in Sports Jennifer Young Graduate Student January 29, 2008
Outline • Warm-Up Puzzle • Modeling in Sports • Resources for Sports Information • Model Basics • Example: World Series Winner • Testing a Model • Problem of the Week
Warm-Up Puzzle Football Tournament
An elimination tournament in football was held between four colleges - Trinity, Tufts, Temple, and Tulane. The winners of the first two games met in the third and final game to decide the championship. The colors of the teams were brown, blue, red, and purple: and the competing captains were Albie, Barry, Bill, and Ben. • Who defeated whom in the play-off: and by what score? Who was the captain of each team? What was the color of each team?
In the final game Albie's team made its only score by a touchdown on the first play, but missed the point after the touchdown. • The red team lost to the Tufts in the first game. • Ben's team defeated Tulane 12 to 0. • The captain of the purple team saved his team from being scoreless in the third game by a 40 yard field goal. • Ben's team did not play Trinity. • Barry's team lost to the undefeated team. • Albie did not see his former friend, the captain of the brown team
Answer! • Game 1: Trinity (Barry, red) vs. Tufts (Albie, blue) • Game 2: Tulane (Bill, brown) vs. Temple (Ben, purple), score was 0 to 12 • Game 3: Tufts (Albie, blue) vs. Temple (Ben, purple), score was 6 to 3 Source: Ask Dr. Math http://mathforum.org/library/drmath/view/55642.html
Intro to Sports Modeling Examples of different types of models used in sports (Hand out example abstracts)
Predictive Models • Examples? • Predicting the winner of the World Series • NCAA March Madness Bracketology
Physical Models • Examples? • Rowing: Model of Oar and Water Interaction • Swimming: Aerodynamic shark skin suits • Basketball: Trajectory of a Free Throw
Fairness Models • Examples? • Baseball: Outfields are different dimensions at different ballparks • UNC Student Ticket Distribution
Scheduling Models • Examples? • Setting up the ACC Football Season Schedule • BCS Football Championship Contraversy
Exercise • In teams of 2: Choose a sport that you are familiar with • List 3 examples of aspects/situations of that sport that could be modeled with mathematics, and give the general genre of math you think you would use to model it
Resources for Sport Info Websites where you can find helpful sporting information
Rules of the Game • http://www.wikipedia.org : If you know NOTHING about the sport this is a good, simple place to start • http://www.hickoksports.com/rules.shtml This site contains information on all kinds of sports (not just the normal ones!). It provides info on the arena or field used, the sporting equipment, and the rules of the game (often includes diagrams).
Statistics • http://sports.yahoo.comGood source for team statistics for various sports • http://www.espn.com Also good source for team statistics, has easily readable team schedules
Model Basics How to assess, attack, and write up your solution
The Modeling Process • Research background info, other models • Make a list of factors that you feel is important to the problem • Rank how important the different factors are, to help you determine which factors should be included and which should be made assumptions • Build your model • TEST your model (Against known data or equations if you can) • Analyze the results/Draw conclusions/Argue your case
A Write-Up Should Include… • Introduction: • Describe the problem, give background, facts • Model Description • Equations, Constants, Assumptions, Procedure • Model Validation • Results from tests, graphs, figures • Analysis & Conclusions • Document your Sources!!!! • When you’re all done, write the Abstract!!! • Summary of your whole paper
Sample Solution Papers • Short one: • What’s good? • What’s missing? • Long one: • Winning solution to a 2003 MCM problem • What’s good?
Example Predicting the Winner of the World Series
Baseball Postseason • Construct a model to predict the winners of the baseball playoffs • Preliminary Questions (Internet search) • How many teams participate in the baseball playoffs? • How do the playoffs work? • What teams were in the playoffs? • Other questions?
What do you think? • How would you attack this problem? • What type of mathematics/modeling techniques do you think should be used here? • Think about it for a few minutes!
My Idea…. • A simple, statistics based model • Choose baseball statistics that you believe are relevant to predicting the winner of the World Series • Create a scoring function that will assign a score to each team based on these stats • The teams with the higher score advances in the playoffs
What factors are important? • How the teams did against one another that season • Who had the better overall record? • Who had the better record in the last 15 games? • Which team is the healthiest? • Who has home field advantage first? • Which team has the better overall batting average? • Which team hit more home runs during the season? • ?????
Choose the factors • Pick which factors are the most important and the easiest to collect data on • Overall record • Last 15 games record • Home runs • Batting average • Home field advantage • How the teams did against each other • Collect the data!
The Data: Statistics Data from sports.yahoo.com/mlb
Data from espn.com The Data: % Wins Against Opnts
Assign Weights to Factors • Rank the factors in order of what you think is important • One possible choice: • How the teams did against each other (10) • Overall record (6) • Home field advantage (4) • Batting average (3) • Home runs (3) • Last 15 games record (2)
Normalize Data • Normalize each data factor to range between (0,1) • Record: (Wins/Total Games) • Last 15 games record: (Wins/15) • Home Runs: (HR/HR of team with most HR) • Batting Avg: (Use given decimal) • Home Field Advantage: (H=1, A=0) • Games against Opponent: (Use given decimal)
The Scoring Function • Team’s Score is the sum of each statistic multiplied by that statistic’s weight • Where T=team score, j=team index number, n=total number of statistics considered, w=weight for statistic i, and s=statistic i • Team with the higher score in each playoff match-up advances to the next round
Testing a Model Matlab Program, How well does our model predict the actual results?
FYI: Matlab Help • Matlab Help Index • Alphabetical if you already know the function you want to use • By subject if you are searching for a function • Or type: help <function name> to get the description • The Internet • Type: Matlab function name or Matlab subject and you’ll find the Matlab help pages • Ex: Matlab plot3d or Matlab ode solvers
A Basic Program for this Model • Download: worldseries.m, stats.data, base07.data • Make sure files get saved to directory that Matlab works in, type pwd on Matlab command line to check what directory you are in • Try to run worldseries.m as is • Take a few minutes to understand what it’s doing • Try to play with the weights/factors • Can you improve my model?
Improvement! • Download: weight_test.m • Take a look at what it’s doing • What turns out to be the best set of weights? • Does this mean our model is the BEST?? Model Limitations Only used 2007 data to test with Many other factors left out
What to include in the write-up • Introduction • 8 teams in single elimination tournament • Model Description • List the factors you choose, explain data collection, scoring function • Testing • Show a few possible models and how they compared • Use graphs, tables • Analysis/Model Limitations/Conclusion • Which model was best, and give your take on WHY • Bibliography • List the sources of your data and any info you used • Abstract • Write up a summary of everything listed here
Problem of the week… UNC Student Ticket Distribution
The Problem UNC has a great men’s basketball team. Tickets for home games at the Dean Dome are in high demand. There are a certain number of tickets set aside for UNC students for each game. Construct a model on how these student tickets should be distributed. Try to think about what would be “fair” to both students and regular patrons. In your answer, try to address the following: How many tickets should be designated as student tickets? How should students sign up for tickets? How should students be selected to receive tickets? How should students be assigned seats? Which seats in the arena should be designated student seats?
Your task… Think about this problem with your teammates or friends this week There are several very open questions here, so try to focus on one of two of them
Thoughts to get you started… What systems have been tried at UNC so far? Bracelets Lottery with Assigned Seats Lottery with Phased Seating Pros and Cons of these systems What type of model would be in the students’/university’s best interest? Think about financial issues, traffic flow, noise levels, convenience, etc. Other questions/issues that come to mind?
Some Useful Websites • www.tarheelblue.com • Attendance statistics can be found here, as well diagram of the stadium, and ticket prices • www.unc.edu/caa • Carolina Atheletic Association, explains the current student ticket policy