Download
1 / 23
230 likes | 364 Vues
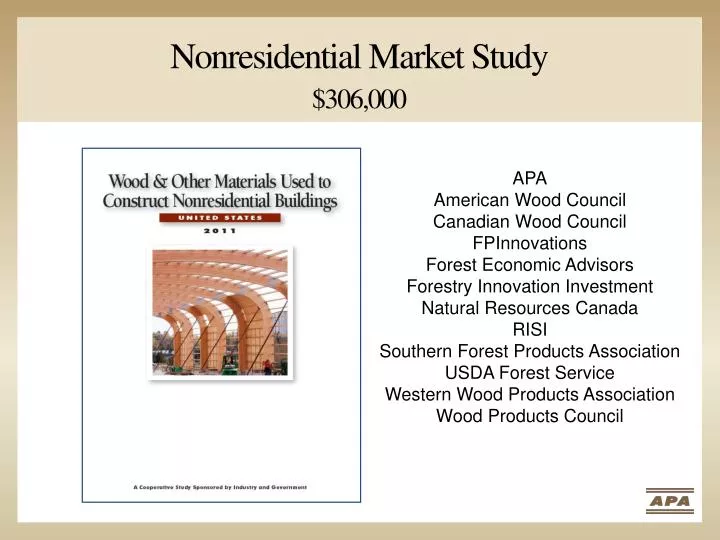
Nonresidential Market Study $306,000. APA American Wood Council Canadian Wood Council FPInnovations Forest Economic Advisors Forestry Innovation Investment Natural Resources Canada RISI Southern Forest Products Association USDA Forest Service Western Wood Products Association

E N D
Nonresidential Market Study$306,000 APA American Wood Council Canadian Wood Council FPInnovations Forest Economic Advisors Forestry Innovation Investment Natural Resources Canada RISI Southern Forest Products Association USDA Forest Service Western Wood Products Association Wood Products Council
The 2003 and 2011 StudiesLumber and EWP Product mix was different 2011 2003
2003 & 2011 Studies 2011 was near the bottom of the current nonresidential construction cycle. Million Sq. Ft. Nonresidential Building Construction Floor Area Six Stories and Under Source: Reed Construction Data
“Primary Structural Materials” for Low-Rise, 2011 (percent of ft2 added) Wood: 12% Concrete: 25% Steel: 63%
Lumber/Engineered Wood by Building Type 2011 (000s) BFE Combined, school / college construction is at the top of the list. Total Consumption: 848 million BFE
Wood Panels by Building Type2011 (000s) ft2 (3/8-inch basis) Combined, school / college construction is number three. Total Consumption: 712 million ft2 (Don’t believe the OSB data.)
Lumber/Engineered Wood Incremental Potential by Building Type and Application (000s) BFE Combined, school / college potential is larger than store construction. Total Potential Gain: 1.95 billion BFE In a year like 2011
Structural Wood Panel Incremental Potential by Building Type and Application, 2011 (000s) ft2 Combined, school / college potential is about the same as office construction. Incremental Potential: 1.3 billion ft2 (3/8-inch basis) In a year like 2011
Assumptions:Typical Year A total of 1,300 Million ft2 new floor area. Million Sq. Ft. Wood use and incremental volumes in 2011 are not what we can expect in a “typical year” like 2005, 2006 or 2007. Source: Reed Construction Data
Assumptions:Typical Year A total of 1,300 Million ft2new floor areaSame mix of building types as in 2003 “Typical” “Recession” 20032011 Stores 37% 21% Schools 17% 28% Industrial 15% 12% Offices 12% 12% Healthcare 6% 10% Hotels 3% 3% Public 1% 10% Other* 9% 4% Total 100% 100% *Religious, Recreation, Miscellaneous
Assumptions:Typical Year A total of 1,300 Million ft2 new floor areaSame mix of building types as in 2003 Same ratio of Repair and Remodeling to New/Major Additions as 2003 Repair & Remodeling as a % of Total Construction “Typical” “Recession” 20032011 Stores 12% 50% Schools 19% 52% Industrial 5% 23% Offices 29% 25% Healthcare 19% 50% Hotels 4% 19% Public 33% 37% Other* 28% 52% All Buildings 18% 46% *Religious, Recreation, Miscellaneous
Assumptions:Typical Year A total of 1,300 Million ft2 new floor areaSame mix of building types as in 2003 Same ratio of Repair and Remodeling to New/Major Additions as 2003 Use 2011 Framing Types – Wood Frame Percentage Old New 20032011 Stores 14% 7% Schools 12% 14% Industrial 12% 7% Offices 41% 12% Healthcare 39% 18% Hotels 52% 54% Public 16% 7% Other* 23% 25% All Buildings 21% 12% *Religious, Recreation, Miscellaneous
Wood Use In A Typical Year All Wood: Lumber, EWP, Panels in Million BFE Stores 375.4 Religious 353.8 Offices 263.2 Schools 228.6 Healthcare 175.4 Miscellaneous 133.5 Recreation 67.3 Public 27.7 Industrial 10.2 All Buildings 1,789.9
Nonresidential BuildingsWood Use in 2011 and a Typical Year Billion Board Feet Billion Square Feet 3.2 BBF 2.6 BSF 1.1 BSF 1.2 BBF Structural Panels Lumber and EWP
Nonresidential BuildingsWood Use And Potential in a Typical Year UsePotential Gain Lumber BBF .9 2.4 Structural Panels BSF 1.1 2.6 Glulam MMBF 99.3 217.7 I-joist MMLF 39.8 87.3 SCL MMFt3 9.3 20.4
Nonresidential BuildingsWood Use And Potential in a Typical Year UsePotential Gain Lumber BBF .9 2.4 Structural Panels BSF 1.1 2.6 Glulam MMBF 99.3 217.7 I-joist MMLF 39.8 87.3 SCL MMFt3 9.3 20.4 Not covered in the study: Farm buildings, parking garages, airports, highway rest facilities and all non-building construction such as roads/highways, mass transit, bridges, water & sewage treatment, dams, marinas, docks, miscellaneous civil engineering projects, conservation and development, shoring, scaffolding, concrete form.
APA's Estimates For Structural Panel Use In 2011 Million Square Feet The StudyAPA Estimate 11 Building Types 476 546 (add 15%) Farm Building & Repair 0 550 Other Buildings 0 90
APA's Estimates For Structural Panel Use In 2011 Million Square Feet The StudyAPA Estimate 11 Building Types 476 546 (add 15%) Farm Building & Repair 0 550 Other Buildings 0 90 R&R 11 Building Types 236 271 (add 15%) R&R Other Buildings 0 25 Concrete Form-buildings/R&R 0170 712 1,652
APA's Estimates For Structural Panel Use In 2011 Million Square Feet The StudyAPA Estimate 11 Building Types 476 546 (add 15%) Farm Building & Repair 0 550 Other Buildings 0 90 R&R 11 Building Types 236 271 (add 15%) R&R Other Buildings 0 25 Concrete Form-buildings/R&R 0170 712 1,652 Non-building Const. 0 1,100 Concrete Form 0170 712 2,922
Nonresidential BuildingsIncremental Potential in a Typical Year
Largest Incremental Gains-Top 3 SegmentsLumber (L), Structural Panels (SP) & EWP West North Central East North Central New England L - O EWP - S EWP - SC L – S, SC EWP - O L - O SP - O EWP – S, O, SC SP - S SP – S, O, SC Mid-Atlantic EWP - O L – S, O, SC EWP – S, SC Pacific L – S, SC SP – S, O, SC SouthAtlantic SP - SC Mountain East South Central West South Central S – Stores, O – Offices, SC - Schools
Largest Incremental Gains-Top 3 SegmentsLumber (L), Structural Panels (SP) & EWP West North Central East North Central New England L - O EWP - S EWP - SC L – S, SC EWP - O L - O SP - O EWP – S, O, SC SP - S SP – S, O, SC Mid-Atlantic EWP - O L – S, O, SC EWP – S, SC Pacific L – S, SC SP – S, O, SC SouthAtlantic SP - SC Mountain East South Central West South Central S – Stores, O – Offices, SC - Schools
Largest Incremental Gains-Top 3 SegmentsLumber (L), Structural Panels (SP) & EWP West North Central East North Central New England L - O EWP - S EWP - SC L – S, SC EWP - O L - O SP - O EWP – S, O, SC SP - S SP – S, O, SC Mid-Atlantic EWP - O L – S, O, SC EWP – S, SC Pacific L – S, SC SP – S, O, SC SouthAtlantic SP - SC Mountain East South Central West South Central S – Stores, O – Offices, SC - Schools