Download
1 / 1
10 likes | 122 Vues
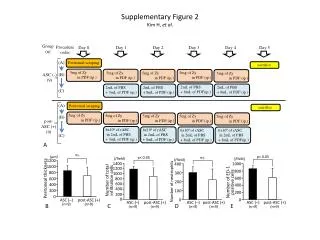
10. 7000. 14. 6000. 12. 5000. 8. 10. 4000. 8. 3000. 6. 6. 2000. 4. 7000. 1000. 2. 14. 4. 6000. 0. 0. 12. 5000. 14. 17. 21. 24. 28. 31. 35. 38. 42. 49. 52. 58. 10. 2. 4000. 8. 3000. 6. 0. 2000. 4. 1000. 2. Day 0. Day 24. Day 31. 0. 0. 14. 17.

E N D
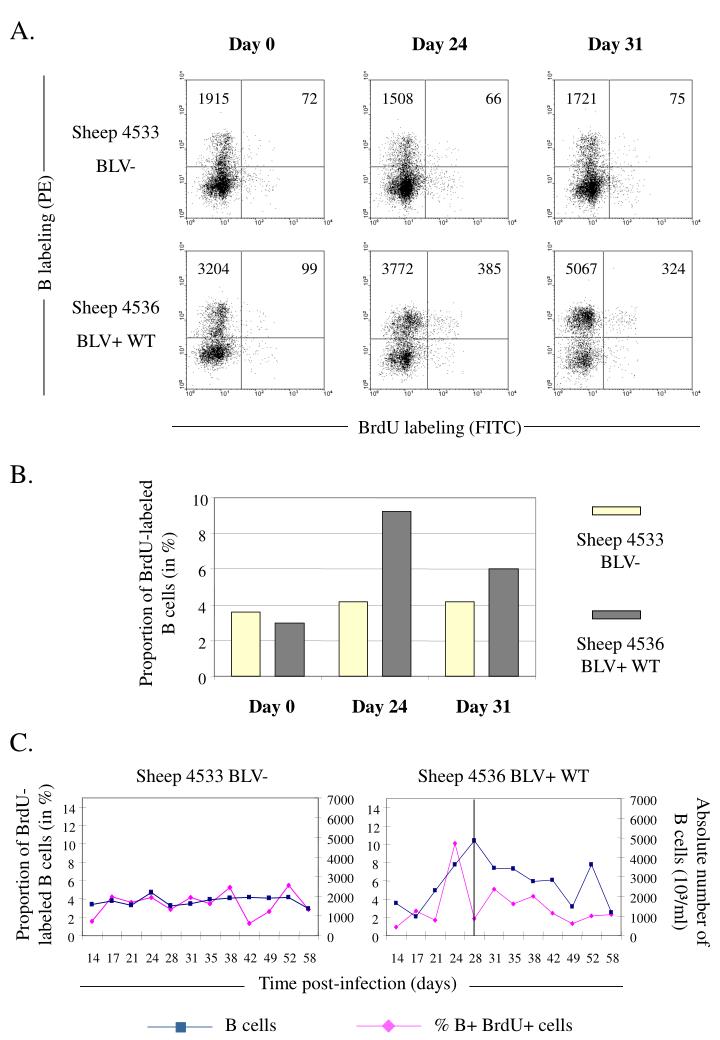
10 7000 14 6000 12 5000 8 10 4000 8 3000 6 6 2000 4 7000 1000 2 14 4 6000 0 0 12 5000 14 17 21 24 28 31 35 38 42 49 52 58 10 2 4000 8 3000 6 0 2000 4 1000 2 Day 0 Day 24 Day 31 0 0 14 17 21 24 28 31 35 38 42 49 52 58 A. Day 0 Day 24 Day 31 1915 72 1508 66 1721 75 Sheep 4533 BLV- B labeling (PE) 3204 99 3772 385 5067 324 Sheep 4536 BLV+ WT BrdU labeling (FITC) B. Sheep 4533 BLV- Proportion of BrdU-labeled B cells (in %) Sheep 4536 BLV+ WT C. Sheep 4533 BLV- Sheep 4536 BLV+ WT Proportion of BrdU-labeled B cells (in %) Absolute number of B cells (10³/ml) Time post-infection (days) B cells % B+ BrdU+ cells