Download
1 / 1
10 likes | 138 Vues
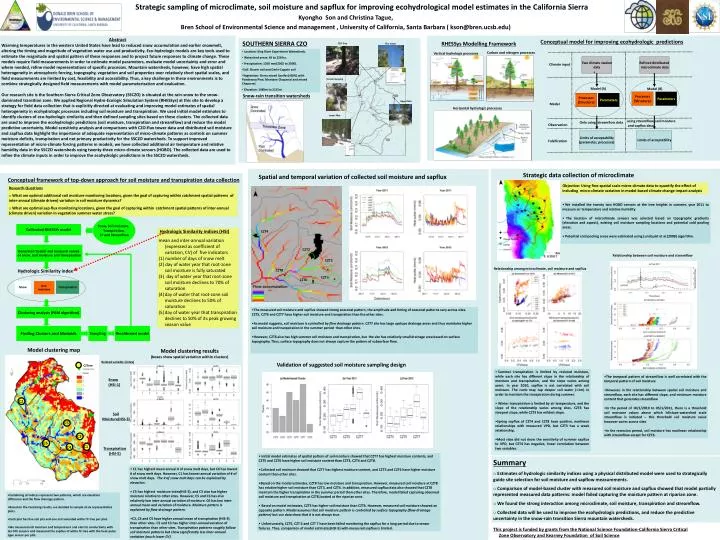
Two climate station data. Refined distributed microclimate data. Climate input. CZT4. Model (A). Model (B). Processes (Structure). Parameters. Processes (Structure). Parameters. CZT7. Model. CZT5. CZT8. using streamflow, soil moisture and sapflux data.

E N D
Two climate station data Refined distributed microclimate data Climate input CZT4 Model (A) Model (B) Processes (Structure) Parameters Processes (Structure) Parameters CZT7 Model CZT5 CZT8 using streamflow, soil moisture and sapflux data Only using streamflow data Observation CZT3 CZT6 Limits of acceptability (parameter, processes) Limits of acceptability Falsification Strategic sampling of microclimate, soil moisture and sapflux for improving ecohydrological model estimates in the California Sierra Kyongho Son and Christina Tague, Bren School of Environmental Science and management , University of California, Santa Barbara ( kson@bren.ucsb.edu) Abstract Warming temperatures in the western United States have lead to reduced snow accumulation and earlier snowmelt, altering the timing and magnitude of vegetation water use and productivity. Eco-hydrologic models are key tools used to estimate the magnitude and spatial pattern of these responses and to project future responses to climate change. These models require field measurements in order to estimate model parameters, evaluate model uncertainty and error and where needed, refine model representations of specific processes. Mountain watersheds, however, have high spatial heterogeneity in atmospheric forcing, topography, vegetation and soil properties over relatively short spatial scales, and field measurements are limited by cost, feasibility and accessibility. Thus, a key challenge in these environments is to combine strategically designed field measurements with model parameterization and evaluation. Our research site is the Southern Sierra Critical Zone Observatory (SSCZO) is situated at the rain-snow to the snow-dominated transition zone. We applied Regional Hydro-Ecologic Simulation System (RHESSys) at this site to develop a strategy for field data collection that is explicitly directed at evaluating and improving model estimates of spatial heterogeneity in ecohydrologic processes including soil moisture and transpiration. We used initial model estimates to identify clusters of eco-hydrologic similarity and then defined sampling sites based on these clusters. The collected data are used to improve the ecohydrologic predictions (soil moisture, transpiration and streamflow) and reduce the model predictive uncertainty. Model sensitivity analysis and comparisons with CZO-flux tower data and distributed soil moisture and sapflux data highlight the importance of adequate representation of micro-climate patterns as controls on summer moisture deficits, transpiration and net primary productivity for the SSCZO watersheds. To support improved representation of micro-climate forcing patterns in models, we have collected additional air temperature and relative humidity data in the SSCZO watersheds using twenty-three micro-climate sensors (HOBO). The collected data are used to refine the climate inputs in order to improve the ecohydrolgic predictions in the SSCZO watersheds. Conceptual model for improving ecohydrologic predictions RHESSys Modelling Framework SOUTHERN SIERRA CZO CZO Tree Flux tower • Location: King River Experiment Watersheds. • Watershed areas: 49 to 228 ha. • Precipitation: 1350 mm(2002 to 2006). • Soil: Shaver soil and Gerle-Cagwin soil • Vegetation: Sierra mixed Conifer(>80%) with Ponderosa Pine, Montane Chaparral and mixed Chaparral. • Elevation: 1485m to 2115m Carbon and nitrogen processes Vertical hydrologic processes Stream Gauging Snow-rain transition watersheds Upper Met. Horizontal hydrologic processes Lower Met. Strategic data collection of microclimate Spatial and temporal variation of collected soil moisture and sapflux Conceptual framework of top-down approach for soil moisture and transpiration data collection Objective: Using fine-spatial scale micro-climate data to quantify the effect of including micro-climate variation in model-based climate change impact analysis Research Questions • What are optimal additional soil moisture monitoring locations, given the goal of capturing within catchment spatial patterns of inter-annual (climate driven) variation in soil moisture dynamics? • What are optimal sap-flux monitoring locations, given the goal of capturing within catchment spatial patterns of inter-annual (climate driven) variation in vegetation summer water stress? • We installed the twenty two HOBO sensors at the tree heights in summer, year 2011 to measure air temperature and relative humidity. • The location of microclimate sensors was selected based on topographic gradients (elevation and aspect), existing soil moisture sampling locations and potential cold pooling areas. • Potential cold pooling areas were estimated using Lundquist et al.(2008) algorithm. Snow, Soil moisture, Transpiration, ET and Streamflow Calibrated RHESSYs model Hydrologic Similarity indices (HSI) mean and inter-annual variation (expressed as coefficient of variation, CV) of five indicators • (1) number of days of snow melt • (2) day of water year that root-zone soil moisture is fully saturated • (3) day of water year that root-zone soil moisture declines to 70% of saturation • day of water that root-zone soil moisture declines to 50% of saturation • day of water year that transpiration declines to 50% of its peak growing season value Generated Spatial and temporal values of snow, soil moisture and transpiration Relationship between soil moisture and streamflow Relationship among microclimate, soil moisture and sapflux Hydrologic Similarity index Snow Transpiration Soil moisture • The measured soil moisture and sapflux showed strong seasonal pattern, the amplitude and timing of seasonal patterns vary across sites. • CZT5, CZT6 and CZT7 have higher soil moisture and transpiration than the other sites. • As model suggests, soil moisture is controlled by flow drainage pattern. CZT7 site has large upslope drainage areas and thus maintains higher soil moisture and transpiration in the summer period than other sites. • However, CZT6 also has high summer soil moisture and transpiration, but the site has relatively small drainage area based on surface topography. Thus, surface topography does not always capture the pattern of subsurface flow. Clustering analysis (PAM algorithm) Finding Clusters and Medoids Sampling Recalibrated model Model clustering map Model clustering results (boxes show spatial variation within clusters) Related variable (index) Validation of suggested soil moisture sampling design CZTree • Summer transpiration is limited by reduced moisture, while each site has different slope in the relationship of moisture and transpiration, and the slope varies among years. In year 2010, sapflux is not correlated with soil moisture. The roots may tap deeper soil water (>1m) in order to maintain the transpiration during summer. • Winter transpiration is limited by air temperature, and the slope of the relationship varies among sites. CZT8 has steepest slope, while CZT3 has mildest slope. • Spring sapflux of CZT4 and CZT8 have positive, nonlinear relationships with measured VPD, but CZT3 has a weak relationship. • Most sites did not show the sensitivity of summer sapflux to VPD, but CZT4 has negative, linear correlation between two variables. • The temporal pattern of streamflow is well correlated with the temporal pattern of soil moisture • However, in the relationship between spatial soil moisture and streamflow, each site has different slope, and minimum moisture content that generates streamflow • In the period of 10/1/2010 to 05/1/2011, there is a threshold soil moisture values above which hillslope-watershed scale streamflow is initiated – this threshold soil moisture value however varies across sites • In the recession period, soil moisture has nonlinear relationship with streamflow except for CZT6. Snow (HSI-1) C2 Soil Moisture(HSI-3) C5 C3 C6 C1 C4 Transpiration (HSI-5) • Initial model estimates of spatial pattern of soil moisture showed that CZT7 has highest moisture contents, and CZT5 and CZT6 have higher soil moisture content than CZT3, CZT4 and CZT8. • Collected soil moisture showed that CZT7 has highest moisture content, and CZT5 and CZT6 have higher moisture content than other sites. • Based on the model estimates, CZT8 has low moisture and transpiration. However, measured soil moisture at CZT8 has relative higher soil moisture than CZT3, and CZT4. In addition, measured sapflux data also showed that CZT8 maintain the higher transpiration in the summer period than other sites. Therefore, model failed capturing observed soil moisture and transpiration at CZT8,located at the riparian zone. • Based on model estimates, CZT5 has higher soil moisture than CZT6. However, measured soil moisture showed an opposite pattern. Model assumes that soil moisture pattern is controlled by surface topography (flow drainage pattern) but our data show that it is not always true. • Unfortunately, CZT5, CZT 6 and CZT 7 have been failed monitoring the sapflux for a long period due to sensor failures. Thus, comparison of model estimates(HSI-5) with measured sapflux is limited. Summary • Estimates of hydrologic similarity indices using a physical distributed model were used to strategically guide site selection for soil moisture and sapflow measurements. • Comparison of model-based cluster with measured soil moisture and sapflux showed that model partially represented measured data patterns: model failed capturing the moisture pattern at riparian zone. • We found the strong interaction among microclimate, soil moisture, transpiration and streamflow. • Collected data will be used to improve the ecohydrologic predictions, and reduce the predictive uncertainty in the snow-rain transition Sierra mountain watersheds. • C1 has highest mean annual # of snow melt days, but C6 has lowest # of snow melt days. However, C1 has lowest annual variation of # of snow melt days. The # of snow melt days can be explained by elevation. • C5 has highest moisture index(HIS-3), and C3 also has higher moisture relative to other sites. However, C5 and C3 has also relatively low inter-annual variation of moisture. C6 has low inter-annual mean and variation of moisture. Moisture pattern is explained by flow drainage pattern. • C3, C4 and C5 have higher annual mean of transpiration (HIS-5) than other sites. C5 and C3 has higher inter-annual variation of transpiration than other sites. Transpiration patterns roughly follow soil moisture patterns but show significantly less inter-annual variation (much lower CV) • Combining all indices represent two patterns, which are elevation • difference and the flow drainage pattern. • Based on the clustering results, we decided to sample at six representative plots. • Each plot has five soil pits and one instrumented white fir tree per plot. • We measured soil moisture and temperature and electric conductivity with ten 5TE sensors and measured the sapflux of white fir tree with the heat-pulse type sensor per plot. This project is funded by grants from the National Science Foundation-California Sierra Critical Zone Observatory and Kearney Foundation of Soil Science