Download
1 / 33
370 likes | 819 Vues
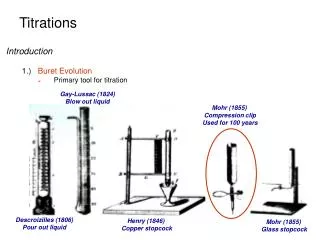
Chapter 12 – EDTA Titrations Lecture 2, Oct 28, 2002. Homework Assignment, Ch 8 (buffers) Problems 5,6,9,11,12,13,18,19,20 Due Fri, Nov 1. Graph of Predominant form of EDTA as a function of pH.

E N D
Homework Assignment, Ch 8 (buffers) Problems 5,6,9,11,12,13,18,19,20 Due Fri, Nov 1
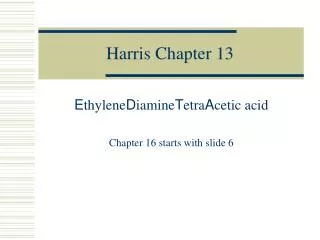
Additional analogs of edta that are analytically important. All of these also strong 1 : 1 complexes with metal ions.
Formation Constants Kf for polydentate metal-complexes The formation reaction for polydentate ligands that form a 1 : 1 complex with metal ions is defined by the reaction M+n + Y-4 < === > MY n-4 and the formation constant Kf = [MY n-4 ] / [M+n] [Y-4] Since the Kf values for most metal-edta complexes are large, it is customary to report them as log10 Kf. log10 Kf for several metal-edta complexes are given in the next slide.
Conditional Formation Constants Kf ‘ The actual value of the formation complexes is generally less than that shown in the proceeding slide primarily due to the effects that the pH have on the complexation reaction. These effects are shown for Ca-edta on the following slide.
pH regions and suggested indicators for EDTA titrations of several metal ions.
Figure 12-7 Titration curves for edta titrations of Mg+2 and Ca+2 Note that the plot is of pM vs Volume of edta. The shape of the curve is very similar to that of acid base titration curves.
Chapter 11 – Chemical Equilibrium Although we have already used concepts of equilibrium in previous chapters, we want to take a more detailed look at this important topic.
Chapter 11 – Chemical Equilibrium Chemical equilibrium describes the distribution of the products and reactants in a reaction mixture. Frequently these relationships are more complicated than first meets the eye. For example, the equilibria (plural) for the solution of slightly soluble lead(II) iodide in water is shown in the next slide.
The percent values give the approximate contribution of each species to the whole.
Chapter 11 – Chemical Equilibrium Although the model of chemical equilibrium predicts that “inert”, that is, non-reactive salts should not affect the solubility, the actual effect is shown in the next slide, where the addition of KNO3 has caused an increase in the solubility of PbI2. In general the addition of such an inert salt causes an increase the solubility.
Chapter 11 – Chemical Equilibrium Our understanding of the phenomena shown on the proceeding slide is that the inert salt increases the ionic atmosphere (environment), allowing each cation or anion to be surrounded by species of the opposite charge, but farther separated from the counter ion which caused its original precipitation.
Chapter 11 – Chemical Equilibrium This effect of the ionic environment within the solution is known as the ionic strength and may be represented as (your author) or I (other authors). = I = ½ (c1z12 + c2z22 +…) = ½ cizi2 The sum of terms includes all of the ions in solution. An example of this calculation is shown in Problem 1
What is the ionic strength of a solution that is 0.0100 M in KNO3 and 0.0100 M Na2SO4? • = ½ cizi2 • = ½ {0.01(+1)2 + 0.01(-1)2 + 0.02(+1)2 + 0.01(-2)2 } • = ½ {0.08} = 0.04M
Activity Coefficients The “actual” or “effective” concentration of an ionic species in solution is known as the activity ; your author uses the symbol A(more commonly used is simply a lower case a); I will use the later symbol, so that his equation 11-2 is written as aC = [C] C
Activity Coefficients The exact equilibrium constant K is then expressed in terms of the activities of the species involved instead of the more commonly concentrations. For the reaction aA + bB < == > cC + dD K = (ac)c(aD)d / (aA)a(aB)b or K = ([C] C)c([D] D)d / ([A] C)a([B] C)b
Activity Coefficients The individual values for the activity coefficients of each of the species is a function of the ionic strength as shown by the extended Debye-Huckel equation: log10 = -0.51z2 / 1 + ( (305)) where is the size of the ion in pm (picometers). Examples of for the F- and I- ions are shown in the next slide.
Activity Coefficients The effects of ionic strength on activity for various charges of ions are shown in the next slide.
Figure 11-4 as a function of for different values of z