Download
1 / 18
310 likes | 789 Vues
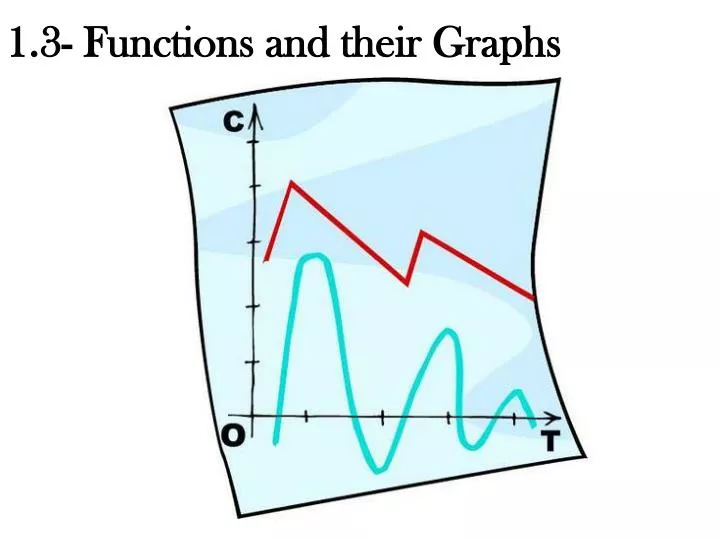
1.3- Functions and their Graphs. 5. 4. 3. 2. 1. -5. -4. -3. -2. -1. 1. 2. 3. 4. 5. -1. -2. -3. -4. -5. Use the graph of the function f to answer the following questions: What are the function values f (-1) and f (1)? What is the domain of f ( x )?

E N D
5 4 3 2 1 -5 -4 -3 -2 -1 1 2 3 4 5 -1 -2 -3 -4 -5 • Use the graph of the function f to answer the following questions: • What are the function values f (-1) and f (1)? • What is the domain of f (x)? • What is the range of f (x)? Example • Solution • f (-l) = 2. • f (1) = 4.
Example cont. 5 4 3 2 1 -5 -4 -3 -2 -1 1 2 3 4 5 -1 -2 -3 -4 -5 • Use the graph of the function f to answer the following questions. • What are the function values f (-1) and f (1)? • What is the domain of f (x)? • What is the range of f (x)? Solution The domain of f is { x | -3 < x< 6} or the interval (-3, 6].
Example cont. 5 4 3 2 1 -5 -4 -3 -2 -1 1 2 3 4 5 -1 -2 -3 -4 -5 • Use the graph of the function f to answer the following questions. • What are the function values f (-1) and f (1)? • What is the domain of f (x)? • What is the range of f (x)? Solution The range of f is { y | -4 < y< 4} or the interval (-4, 4].
The Vertical Line Test for Functions • If any vertical line intersects a graph in more than one point, the graph does not define y as a function of x.
Use the vertical line test to identify graphs in which y is a function of x. a. b. c. d. y y y y x x x x a. b. c. d. y y y y x x x x y is not a function since 2 values of y correspond to an x-value. y is a function of x. y is a function of x. y is not a function since 2 values of y correspond to an x-value. Text Example Solution y is a function of x for the graphs in (b) and (c).
(x2, f (x2)) (x1, f (x1)) (x1, f (x1)) (x2, f (x2)) (x1, f (x1)) (x2, f (x2)) Increasing Decreasing Constant Increasing, Decreasing, and Constant Functions
a. b. 5 5 4 4 3 3 2 1 1 -5 -4 -3 -2 -1 1 2 3 4 5 -5 -4 -3 -2 -1 1 2 3 4 5 -1 -1 -2 -2 -3 -3 -4 -4 -5 -5 Describe the increasing, decreasing, or constant behavior of each function whose graph is shown. Example Solution a. Decreasing on the interval (-oo, 0), increasing on the interval (0, 2), and decreasing on the interval (2, oo).
a. b. 5 5 4 4 3 3 2 1 1 -5 -4 -3 -2 -1 1 2 3 4 5 -5 -4 -3 -2 -1 1 2 3 4 5 -1 -1 -2 -2 -3 -3 -4 -4 -5 -5 Describe the increasing, decreasing, or constant behavior of each function whose graph is shown. Example cont. Solution b. Constant on the interval (-oo, 0). Increasing on the interval (0, oo).
Definitions of Relative Maximum and Relative Minimum • A function value f(a) is a relative maximum if it is a “peak” in the graph. • A function value f(b) is a relative minimum of f if is a “valley in the graph.
The function f is an even function if: f (-x) = f (x) for all x in the domain of f. The function f is an odd function if: f (-x) = -f (x) for all x in the domain of f. Definition of Even and Odd Functions
Identify the function as even, odd, or neither: Solution: We use the given function’s equation to find f(-x): Example: So this is an EVEN function!
Example: Identify the function as even, odd, or neither: Replace x with -x: So this is an ODD function!
Even Functions and y-Axis Symmetry • The graph of an EVEN function in which f (-x) = f (x) is: symmetric with respect to the y-axis.
Odd Functions and Origin Symmetry • The graph of an odd function in which f (-x) = - f (x) is: symmetric with respect to the origin.