Download
1 / 15
150 likes | 155 Vues
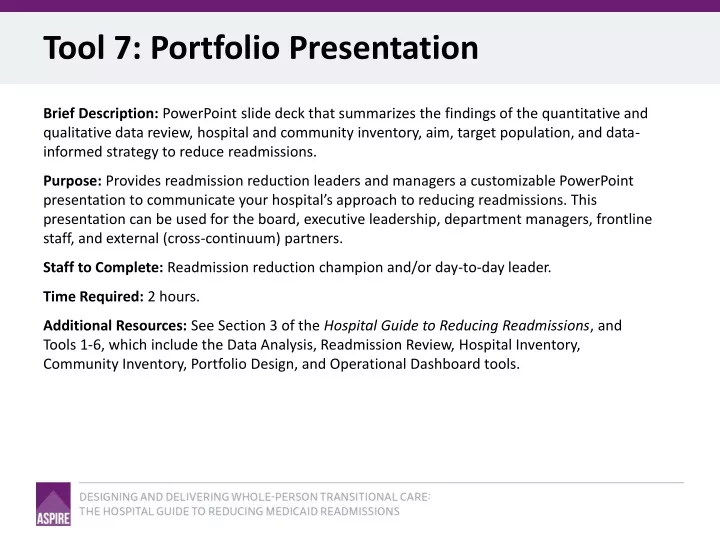
Tool 7: Portfolio Presentation. Brief Description: PowerPoint slide deck that summarizes the findings of the quantitative and qualitative data review, hospital and community inventory, aim, target population, and data-informed strategy to reduce readmissions.

E N D
Tool 7: Portfolio Presentation Brief Description: PowerPoint slide deck that summarizes the findings of the quantitative and qualitative data review, hospital and community inventory, aim, target population, and data-informed strategy to reduce readmissions. Purpose: Provides readmission reduction leaders and managers a customizable PowerPoint presentation to communicate your hospital’s approach to reducing readmissions. This presentation can be used for the board, executive leadership, department managers, frontline staff, and external (cross-continuum) partners. Staff to Complete: Readmission reduction champion and/or day-to-day leader. Time Required: 2 hours. Additional Resources: See Section 3 of the Hospital Guide to Reducing Readmissions, and Tools 1-6, which include the Data Analysis, Readmission Review, Hospital Inventory, Community Inventory, Portfolio Design, and Operational Dashboard tools.
Readmissions: Current State • [Hospital’s] current readmission rates: • Medicare FFS: [from data analysis] • Medicaid (managed or FFS): [from data analysis] • Hospitalwide (adult non-OB): [from data analysis] [insert 1-2-3 year monthly readmission rates with a trendline indicating whether readmission rates are improving] or [insert how current rates compare to state or national averages] or [insert how current rates compare to top 10% performers]
Why Update Our Readmission Reduction Strategy? • [insert rationale for quality, patient experience here] • Commitment to delivering the right care, right location; many readmissions reflect a failure to deliver on that commitment. • Considering “whole-person” needs following a hospitalization is a commitment to delivering safe, effective, and person-centered care. • [insert rationale for current financial incentives here] • Share Medicare readmission penalty amounts since FY13 • Share Medicare value-based purchasing gains/losses this year • Share [any] Medicaid penalties or gains/losses for risk contracts • [insert rationale for future financial incentives here] • Share plans for transitions to risk- or value-based contracts • [insert other vision/mission/stewardship commitment here]
Insights From Readmitted Patient Interviews • [use direct quotes when possible] • [provide 2-3 sentence vignettes of readmitted patients] • [summarize themes] • [highlight unexpected findings] • [avoid medicalized interpretations such as “noncompliant”]
What Exists: Hospital and Community Inventory Hospital-Based Efforts • [readmission flag] • [readmission risk assessment] • [automated primary care notification] • [medication reconciliation efforts] • [whole-person needs assessment] • [interdisciplinary care planning] • [goals of care discussions] • [palliative care] • [customized patient information] • [teach-back] • [schedule appointments and services] • [bedside delivery of medications] • [warm handoffs] • [followup phone calls] • [transitional care programs] Community-Based Efforts • [adult day health programs] • [PACE, SCO, other total care providers] • [comprehensive behavioral health centers] • [community mobile crisis teams] • [behavioral health homes] • [Medicaid health homes] • [community health worker programs] • [peer support programs] • [social support services] • [medical-legal advocacy services] • [housing with services agencies] • [physician/provider home visit services] • [use of INTERACT processes and tools] • [SNFs with onsite clinical providers] • [front-loaded home care episodes] • [home care agencies with behavioral health expertise]
Readmission Reduction Goal and Target Population(s) • [specify the hospital’s specific readmission reduction goal]: • what will be achieved [e.g., reduce readmissions] • for whom – specific target population [e.g., for all adult inpatients] • by how much [e.g., by 20%] • by when [e.g., over the next 2 years] • [specify the target population or populations] • [e.g., Hospitalwide readmissions, all adult non-OB inpatients] • [e.g., patients at high risk of readmission: adult non-OB Medicaid, any behavioral health comorbidity, or any unmet social need] • [e.g., patients with a personal history of 4+ hospitalizations/year] • [e.g., all patients discharged to postacute care]
Readmission Reduction Goal and Target Population(s) • Goal: [state goal] • Current rate: [x%] • Current number of readmissions: [y] • [goal reduction] in readmissions: [z fewer readmissions per year] • Target population: [specify] • Number of discharges per year in target population(s) • Number of readmissions per year in target population(s) • Number of discharges per month in target population(s) • Number of readmissions per month in target population(s) • Number of readmissions avoided per month in target population(s) if [goal reduction] is achieved
Readmission Reduction Team • Executive sponsor • Champion • Day-to-day lead • Team members • Nursing • Case management • ED • Hospital medicine • Social work • Chaplain • Pharmacy • Data analyst • IT • Key 2-4 community partners
Measures of Success • Monthly implementation statistics • % of patients who received intended service(s) • [specify services, such as completed discharge checklists, or appointments scheduled, or followup phone calls completed] • Aim to achieve >80% reliable delivery of intended services • Monthly readmission rates • Hospitalwide • Specific target populations • [Aim to see a measurable trend of improvement within 9 months] • [Aim to achieve goal by month 24]
Next Steps and Timeline • [consider organizing the next steps by “driver” rather than department to promote interdisciplinary collaboration]