Download
1 / 26
260 likes | 406 Vues
Automated Peak Discharge Determination System. David B. Knipe, PE, CFM Robert W. Wilkinson 2010 Indiana GIS Conference February 23, 2010. Need for Peak Discharges. Water resources planning, management, and permitting by Federal, State, local agencies

E N D
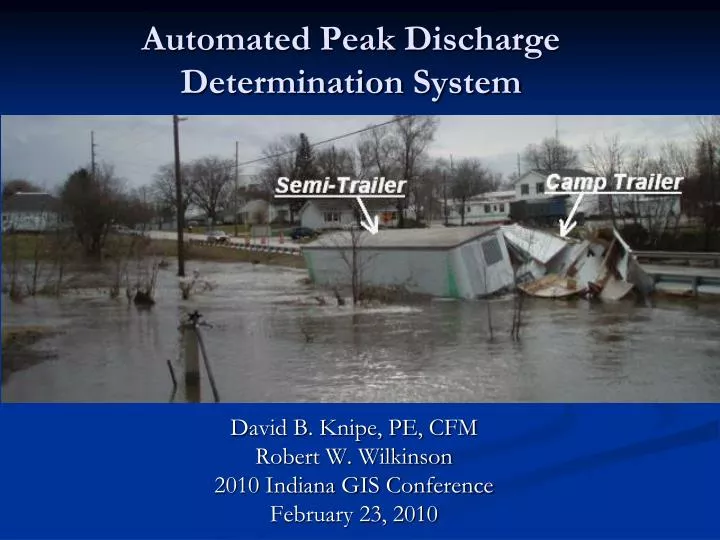
Automated Peak Discharge Determination System David B. Knipe, PE, CFM Robert W. Wilkinson 2010 Indiana GIS Conference February 23, 2010
Need for Peak Discharges • Water resources planning, management, and permitting by Federal, State, local agencies • Instream flow determinations for controlling pollution and protecting habitat • Designing and permitting facilities such as wastewater-treatment plants, hydropower plants, and water-supply reservoirs • Designing structures such as roads, bridges, culverts, dams, locks, and levees
Streamstats (USGS) • StreamStats uses cutting-edge technology to put stream information in the hands of users • Design is based on the ArcHydro Data Model and the functionality of the ArcHydro Toolset • Design is flexible and expandable • Fully implemented for Indiana • Includes a web service functionality
Coordinated Discharges • Memorandum of Understanding signed in 1976 • Coordinate discharges between agencies for planning and design purposes • U. S. Army Corps of Engineers • USGS • NRCS • IDNR / Division of Water
Indiana Peak Discharge Determination System • Design complete working out last of the bugs • Uses Streamstats to derive hydrologic parameters • Uses Unity DDL to search for other comparable determinations • Delivers a Excel spreadsheet summarizing all data • To be delivered as a portal and used by consultants for discharge determinations
Automated Peak Discharge Determination System The only limitation of GIS is your lack of imagination and inventiveness! MGySgt R.N. Wilkinson, USMC Robert N. Wilkinson 317-234-1094 rnwilkinson@dnr.IN.gov
“THE IDEA” SAVE: 5 to 7.5 hours of intensive labor per discharge Unity Database Location submission USGS Streamstats SQL Query done by stream name Historical Discharge data For comparable determinations Stream’s hydrologic parameters - Streamstats Watershed determination Stream Name, Honey Creek CSL10_85,13 CONTDA,6.774 NSSREGNO,1008 WETLAND,0.61 DRNAREA,6.774 URBAN,0.43 Region,4 HighPredInt,2180 LowPredInt,993 ValuePk100,1470 CALCULATIONS - Short list
MODEL BUILDER SOLUTION Combination of ArcToolbox tools and Python scripts • Four Processes • Streamstats query • Unzip retrieved data • Attribute data point • Unity query and final product Highly recommend taking Melissa Brenneman’s “Creating Models with Model Builder” for basic Model Building instruction.
Creating Needed Tools - PROGRAMMING Sometimes GIS software needs a little help - *PYTHON* Programming language VBA programming C++ programming Various others Tools can be created for modeling using various programming languages. Intermixed with tools from ESRI, models can do about anything. Not a simple process Not an instant result as models and programs have to be massaged for desired results.
Model Builder Symbols Parameter – input required ArcToolbox Tool Resulting Output Permanent file or intermediate data Python Script – creating process
Data from STREAMSTATS Your Input (Tool parameter) Input Discharge point Stream Name Adds the points UTM coordinates to xml (Tool) Sends accurate point to Streamstats website to calculate: (Script) Watershed polygon shapefile Watershed data Writes data to text file for later use (Script)
Unzip data from Streamstats URL Unzip the data files from streamstats GlobalWatershedIN.shp – polygon GlogalWatershedInpoint.shp – the point file Streamstats.xml – data file that defines watershed data Sets point file for GIS process
Adding Required Attributes for Unity SQL query Added through Toolbox tools. For data comparison based on location: Attributes are added through spatial joins Intermediate steps results not kept Final shapefile has all attributes required for next step. All data comes from shapefiles added to MXD for speed Could just refer to it through data path, but will limit speed and dependability.
Building the final product Three Python scripts: One - coordinates all data required for computations into a text file. Two - logs into Unity database and does four queries to retrieve data for comparison purposes. Three - takes all data from sources and creates a five tab spread sheet. DDL.xls is final product with all data requirements for engineering designs.
Automated Peak Discharge Determination System MXD BASE Map for APDDS Model is run by right click and open DischargeCalc Will pin point work area by zooming in. Counties outlined, as you zoom in maps will appear as background Streams are depicted by large blue pixel lines when zoomed in far enough
Opening and Running MODEL Zoom into the site Make sure you are in enough to display the blue pixel lines! Right click DischargeCalc in TOC Select “Open”
Project Selection and Stream Name Select your Discharge Location: Select point on stream You must be on blue pixel! Type Name of stream Spelling critical! Must spell out stream type Creek River Ditch You can not abbreviate! Space between Name and type required.
MODEL RUNNING Once you hit OK DischargeCalc Dialog Box will appear This box will show which step in the model the process is on. Any error messages will show in “RED” print and describe the error. Database and connectivity errors can result in this model not completing. Error problems need to be reported to me for troubleshooting.
Creating the Final Product A Warning: will appear when the data is being written to a spread sheet. Press OK no matter what it says! This Warning may come up several times Continue to accept by pressing OK.
Final Product – DDL.xls Excel Spread Sheet Set to open on your screen 3 worksheets with required data This is the first worksheet that displays Shows Stream Name County Discharge Area Graph of collected data **User is responsible for saving this spread sheet to a location of their choice!**
Request Form Tab Basic data returned from Streamstats: From Streamstats.xml Stream Name added from your input.
Results Tab Selected UNITY data Stream Name Regression Equations Identical Streams Top 5 matches in Unity Same Stream Name, closest 5 in size of area Similar Streams Top 10 from Unity Top 10 historical discharges within a given distance and in Basin. Nearby Gaged Streams Top 5 from Unity Nearest historical “Gaged” determinations Nearby Coordinated Discharges From CQ shapefile, not Unity Determined from closest locations to new determination User Input Discharge Values Free space for users input Discharge from Power Equation Fit Line Calculated Discharge Value