Download
1 / 38
380 likes | 385 Vues
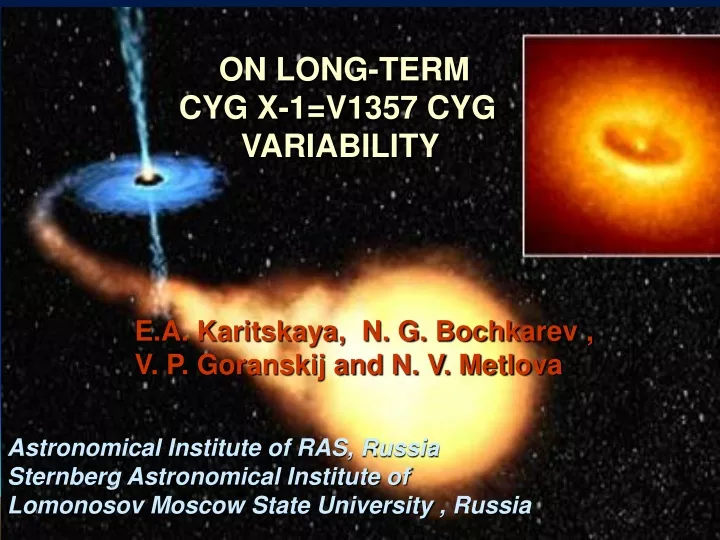
ON LONG-TERM CYG X-1=V1357 CYG VARIABILITY. E.A. Karitskaya, N. G. Bochkarev , V. P. Goranskij and N. V. Metlova. Astronomical Institute of RAS, Russia Sternberg Astronomical Institute of Lomonosov Moscow State University , Russia. Cyg X-1 = V1357 Cyg = HDE 226868.

E N D
ON LONG-TERM CYG X-1=V1357 CYG VARIABILITY E.A. Karitskaya, N. G. Bochkarev , V. P. Goranskij and N. V. Metlova Astronomical Institute of RAS, Russia Sternberg Astronomical Institute of Lomonosov Moscow State University, Russia
Cyg X-1 = V1357 Cyg = HDE 226868 Cyg X-1 = V1357 Cyg = HDE 226868 is an X-ray binary system (with theorbital period P = 5:6 d) whose relativistic component is historically the firstcandidate black hole (BH) and a prototype of X-ray binaries with black holes. Cyg X-1 is a microquasar having jet during its low “hard” state. It isthe brightest object among the high-mass black hole X-ray binaries (mV = 9 mag). The optical component, an O9.7 Iab supergiant, is responsible for about 95% of thesystem's optical luminosity. The remaining 5% are due to the accretion structure(disk and surrounding gas) near the BH. Intensive investigations of Cyg X-1 areunder way for 50 years (more that 4000 paper on Cyg X-1 have already beenpublished), but a lot of phenomena in the system remain unclear.
Scheme of X-Ray Binary Cyg X-1 Porb = 5.6d Pprec = 294d scattering gas black hole Mx= 7-10 Msun . hot line accretion disc jet hot spot on the disc tidally distorted collimated stellar wind supergiant -- accretion stream MO=20-30 Msun . Distance d = 1.8-2.0 kpc
The orbital light curveCyg X-1/V1357 Cyg (P=5.6d ) - two wave (the ellipsoidal effect), the full amplitude ~0.04m. The scattering of points is physical variations. Lyuty observations were used
The ellipsoidality effect-ROCHEmodel-admissible parameter values for Cyg X-1 • 40 years agoin our paper Bochkarev N.G. Karitskaya E.A., Shakura N.I., Soviet Astronomy Letters, vol. 1,1975, p. 118-120: for A = 0.035 - 0.050m, delta A <0.005m, d > 2kpc, Teff < 35000 K, f(M)=0.23 Msun the admissible values of Cyg X-1 parameters were obtained: 25°<i<67°; 0.2<q<0.8; 0.8<μ<1; Mo>17Msun; 7Msun<Mx<27Msun D C A B Our admissible values (bold lines) for the mass ratioqas a function of the orbital inclination angle ivs 4 best models A-D from J.A.Orosz et al. Astro-ph, 1106.3689, 18 June 2011, d = 1.86+/-0.12 кpc (Reid et al. 2011).
J.A.Orosz et al. ApJ , 742, Dec 2011 J.A.Orosz et al. ApJ , 742, Dec 2011 V.М.Lyuty, 2003-2006гг. Модель D Модель А V-bund1996-1998, cooperative program, FSU V.М.Lyuty, 1971-1986
J.A.Orosz et al. ApJ , 742, Dec 2011 Model D Table 2 Cygnus X-1 Final Parameters Parameter Value i (deg) 27.06 ± 0.76 Ω 1.400 ± 0.084 e 0.018 ± 0.003 ω (deg) 307.6 ± 5.3 Mopt (M) 19.16 ± 1.90 Ropt (R) 16.17 ± 0.68 log g (cgs) 3.303 ± 0.018 M (M) 14.81 ± 0.98 J. Zi´ołkowski, 2014talked about the contradiction of 19.2 Msunvalue to theory of evolution – mass-luminosity relation for massive core hydrogen burning.His most probable estimation for the star and black hole are 27 Msun and 16 Msun. If the hydrogen content of the supergiant decreases to 0.6, the stellar mass get smaller from 27 to 24 Msun. J. Cˇechura, S. D. Vrtilek and P. Hadrava, 2015 adopted the values 24 и 8.7 Msun (q=0.36)
Other methods are needed For example new method of 2D Doppler tomograms for the component mass ratio q determination we have developed and obtained 1/4 < q < 1/3 (Karitskaya E. A., Agafonov M. I., Bochkarev N. G. et al. 2005, 2007) -red line Abubekerov et al (2004) have puted limits on inclinational angle i<44 deg by the shape of radial velocity curve (green line) D C A B
Accumulated observational material • 40-year long series of multicolor photometric observations – UBVR observations by Lyuty, Metlova et.al from 1971 to present times (Crimea laboratory, Sternberg Inst.) Observational data from different observatories during two cooperative programs of X-ray sources in former Soviet Union (including ours) + James Kemp observations, including linear polarisation In the frame of the 1994-1998 international campaign “Optical Monitoring of Unique Astrophysical Objects", 2258 UBVR observations of Cyg X-1 were performed during 407 nights. • 12-year-long series of precision spectral observations • X-ray RXTE ASM observation archive (1996-2010)
High-resolution spectral observations from 2002 • Peak Terskol Observatory (Central Caucasus, Russia): 2-m telescope echelle-spectrographs: • - Coude Focus: • R = 45000, 3700 - 10300 Å; -- Cassegrain Focus: R = 13000, 3800 – 7600 Å. • BOAO Observatory (South Korea): 1.84 m telescope fiber echelle-spectrograph: R = 44000 & 30000, 3800 – 10000 Å. During 33 nights in 2002 - 2004 75 spectra were obtained.
Spectral observations BTANESeshelle spectrograph (2k x 2k) CCD camera 21nights 2005-20013 гг. 70spectra Sum. expos. 50 hoursR=60000 (5 кm/s) S/N~330 (up to 500 for resolution element) Mexican Guillermo Haro Observatory, Cananea, Sonora 2.1 m tel., R = 13000 CFHT, ESPaDOnS,Havaii, 3.6 m tel., 3850-10400 А, S/N~ 700, R=65000, 12 Sept. 2014 , 1 spectrum, exposition 80 min.
The X-ray Flare of June 13, 2003 According to RXTE/ASM data, the X-ray flux F(1.2-12 keV) increased by a factor of 1.7 in 3.7 hours (the time-interval between the expositions) The line profile variations: F=0.79 F=0.79 F=0.76 F=0.76 Ф is orbital phase Intensity of HeII 4686A line was increased and Hα line was decreased. So circumstellar gas ionization was increased during the X-ray flare.
Model atmosphere of Cyg X-1 optical star The main results are reported in: • Karitskaya, E. A.; Agafonov, M. I.; Bochkarev, N. G.; Bondar, A. V.; Galazutdinov, G. A.; Lee, B.-C.; Musaev, F. A.; Sapar, A. A.; Sharova, O. I.; Shimanskii, V. V., 2005, Astronomical and Astrophysical Transactions, vol. 24, Issue 5, p.383-389 • Karitskaya E.A., Lyuty V.M., Bochkarev N.G., Shimanskii V. V., Tarasov A. E., Bondar A. V., Galazutdinov G. A., Lee B.-C., Metlova N.V., Long-Term Variations of the Supergiant in the X-Ray Binary Cyg X-1. Inf. Bull. Var. Stars, No. 5678, 2006, p. 1-4. • Karitskaya, E. A.; Shimanskii, V. V.; Sakhibullin, N. A.; Bochkarev, N. G., Peculiarities of the Chemical Composition of the Optical Component of Cyg X-1. In: Why Galaxies Care about AGB Stars: their Importance as Actors and Probes. ASP Conf. Series, V. 378, Eds.: F.Kerschbaum, C.Charbonell & R.F.Wing, 2007, p. 123-124. • Shimanskii, V. V.;Karitskaya E.A., et.al Astronomical Rep. 2012
By comparing the observed high-resolution spectra to model non-LTE ones, itbecomes possible to put limitations on the parameters of the O supergiant (theoptical component of Cyg X-1): Teff = 30400 +/- 500K, log g =3.31 +/- 0.07, element abundance excess: from 0.4 dex to 1.0 dex for He, N, Ne, Mg, Si, that is, products of CNO- and alpha-processes. It looks like the mixing of matter ought to be far more effective in that object than in the single star alpha Cam, due, in all probability to tidal interaction and mass exchange with the relativistic component at the preceding and present stages of the system evolution.
Cyg X-1 spectra simulation technique 3) Two types of outer illumination spectra “soft” - “hard”(A.Zdziarski, M.Gierlinski, (Prog. Theor. Phys. Suppl. No.155, 2004); • The SPECTR code • (Sakhibullin, Shimanskii, 1997): 1) Illuminated atmosphere models with heating and cooling balance (Ivanova et al., 2002); 2) Equipotential shape of a star that almost fills its Roche lobe (Shimanskii, 2002); 4) A synthetic spectrum based on 580000 spectral lines (Shimanskii et al., 2003); 5) Direct computation of non-LTE effects for HI, HeI, MgII, SiIV with influence of outer illumination (Ivanova et al., 2004).
The obtainedresults: • O-star fundamental parameters: Teff = 30400 +/- 500K, log g =3.31 +/- 0.07, [He/H] = 0.43+/-0.06, • Chromosphere with a temperature excess up to 5000K is formed during the “soft” state of Cyg X-1 only. • X-ray radiation of any type causes no sensible effect on HI, HeI, MgII, CII, etc. profiles. • P Cyg emission components in HeI λλ4387, 4471, 4713, 4921, 5876 Å profiles; • Hot wind outflow from the O-star surface at optical depth logτ < -2.0. erg/s theor theory theory obs Obs
Multiwavelength photometryPhotometric observations and comparison with X-ray data The main results are reported in: • Kemp J., Karitskaya E.A., Kumsiashvili et al. 1987, Astron.Rep., • Karitskaya E.A., Goranskij V.P., Grankin E.N. et al.: 2000, Astronomy Letters, 26, 22. (Pis'ma v Astron.Zh., 26, 27); • Karitskaya A.A., Voloshina I.B., Goranskij V.P. et al.: 2001, Astron.Rep., 45, 350.(Astron.Zh., 78, 408); In Kemp et al. we confurmed the existence of the 294-day period in optical variations revealed byPriedhorsky et.al. 1983 in X-ray. The observational material included a many-year series of photoelectric observations of Cyg X-1 obtained in the frame of a cooperative program to study X-raysystems, conducted in the USSR.
Optical manifestations of 294-day period In Kemp J., Karitskaya E.A., Kumsiashvili et al. 1987 1912 B photometrical points 1971-1985 were collected Obtained in the frame of a cooperative program to study X-raysystems, conducted in the USSR + observations by J. Kemp The “precession” period P=294 day • The variations of average brightness level by 0.01 mag • Variations of the shape of the orbital light curve with the phaseof P=294 day- the running hamp along the orbital light curve with the amplitude 0.01 mag in the the direction of the orbital phase increasing- the direction of the disk precession coincides with that of the orbitalmotion. • agree well with the model of a tilted (j =10-15 grad) precessingaccretion disk, which radiates in the optical range and also scattering andreprocessing the radiation of the supergiant. F=0.0 F=0.5 Опт В X набл
In Karitskaya. et al.: 2000,2001: In the frame of the international campaign ”Optical Monitoring of Unique Astrophysical Objects” (Georgia, Kazakhstan, Russia, Uzbekistan, and Ukraine) in 1994-1998: • 2258 UBVR observations made during 407 nights 1994-1998. • Comparison with ASM/RXTE (1.3-12 keV) 1996-2001 data – 1806 daily points
The orbital light curve P=5.6 d ASM RXTE X-Ray 1996-2001 1996 г. V-band 1996-1998 The amplitudeA=0.045+/-0.002 mag The difference minima depth deltaA=0.003+/-0.002 mag
Besides the orbital variation in optics and X-rays there are: • The average level variation of brightness, “precessional” period 147/294дн. In X-rays “hard” –”soft” state transition - years • The flares of several day duration ~0.04 mag, for exampleJune, 2 andOct., 9 in 1996 , coinciding with 20% Х –ray weakening of the same duration. • The flares of from several hours to one day~0.025 зв.в. correlating with Х –ray flares and not depending with orbital phase. • Dips, including week-long fading on~0.04 maginUBVR, which correlates with 20% Х –ray weakening early November, 1996 JD2450390-397; short - time weakening JD2450257.
X-ray variations delays in respect to the optical ones The correspondence between optical and Х-ray variations. Cross-correlation analysis of the X-ray and optical mean brightness shows significant correlation. The X-ray variations delays in respect to the optical one - 7 d delay in 1996 and 12 d - in 1997-1998(the main 1996 X-ray outburst and the mean orbital optical and X-ray light curves were subtracted from the X-ray and optical data). For 1997-1998 we derived a correlation, with the X-ray light curve lagging 12 +/-- 2 days relative to the optical light curve, with a significance level substantially exceeding 99.99%(Karitskaya et al. 2001). • Evidences of mass transfer instability
Evidences of instability of matter flowing between the components • 1. The shape variations of X-ray orbital light curve. • 2. Unusual optical deep fading in November,1996. • 3. Several-day-long optical flares coincided with X-ray dips. The suggested scenario of flares and dips Thescenario of observed X-ray delays and several-day-long optical flares coincidingwith X-ray dips was suggested (Karitskaya 1998). According to this scenario,matter flows from time to time in separate portions from the supergiant towardsthe accretion structure, forming separate clots. Every clot produces a shock waveand a bump at the outer rim of the accretion structure, which, in their turn,produce a prolonged optical flare, while the scattered matter produces additionalabsorption of the soft X-ray flux (dip). The remaining matter, after the timeinterval necessary to cross the accretion structure (disk), produces an X-ray flare. • The characteristic time of the matter transfer through the accretion disk • was about 7 days in Summer and Autumn 1996 and 12 days in 1997-98 • contradict to standard disk accretion theory . Accretion go through high altitudes.
Cyg X-1 system supergiant variability The 35-year long series of observations performed by V.M.Lyuty at SAI Crimean Laboratory revealed the supergiant light variation on the time-scale tens of years.
Cyg X-1 system supergiant variability E.A. Karitskaya, V.M. Lyuty, N.G. Bochkarev, V.V. Shimanskii, et al., 2006a, Long-Term Variations of the Supergiant in the X-Ray Binary Cyg X-1, IBVS, No.5678, pp.1-4. Spectral observations at Crimean Astrophysical Observatory in 1997 performed in the Coude focus of the 2.6 m telescope R=35000, λλ 4655-4722AJune 15-August 16, 1997. 20 spectra were obtained. Brightness variations in U-band and X-ray activity There is the correlation between U brightness fading and X-ray activity increasing according ASM/RXTE !!! The data were compared with the data obtained at Terskol Observatory and at BOAO (South Korea).
HeI 4713 A line profile: 1997 vs 2004 data • The 1997 line profile is different – less deep than the 2004 one. • One example of non-LTE computation for 1997 data is given. • Logg =3.32 is found not to be in agreement with the photometric changes. Therefore combined analysis of photometric and spectral variability has been performed.
Averaged magnitude differences for 2004 vs 1997 according to V.M.Lyuty’s photometric observations: • deltaU 0.065±0.003 m, • deltaB 0.031±0.003 m, • deltaV 0.029±0.003 m. Simultaneous matching of non-LTE simulation of the photometric variability and HeI 4713 A line profiles against the observed ones shows that from 1997 to 2003-2004: • The star radius has increased by 1-4%, • The temperature has decreased by 1300-2400 K. X-ray activity increasing after 1996 is believed to be a result of the supergiant parameter changes.
Continuation of the history of Cyg X-1 variations • After the death of V. M. Lyuty the unique UBV observational series was extended by N.V.Metlova with the same equipment on SAI 60-cm telescope, Crimea. • The brightness dropping in the whole continues to this day, although separate maximasometimes take place. • The very blue flare in 2009 is very interesting
X-ray flare High “soft” states Abrupt U brightness increasing corresponds to X-ray flare. It may be connected with the appearance of hot gas with large emission mearsurment EM.
Long time variations of HeI4713A profile Variations of depth is connected with V mag average level variations !
H-beta profile variation =0.03 -250 0 250 Vr km/s In H-beta profile on the orbital phase =0.03 the gas component was appeared in 2007 year.
Conclusions of last investigations • The mean level of brightness changes – from 1999 year the brightness decreases on average. Time scale of year variations are imposed on this falling. • Connection of variability in X-ray with variability in optics which is in agreement with the idea that as brightness decreases the supergianttemperature decreases while its radius increases approaching a criticalRoch lobe. It makes the matter flowing unstable which leads to frequent, non irregular “hard” – “soft” X-ray state changes. • Signs of presence at the system of an variable optically thin gas components may appear. During X-ray flare in 2009 year the increasing of hot optically thin gas took place. This has led to a flare in U band only.
ХВАЛА!!! БЛАГОДАРЯ!!! СПАСИБО!!! THANK YOU!!!