Download
1 / 1
10 likes | 144 Vues
Chronic Disease Management: A Marriage of Business Intelligence and Care Process Models. John Wadsworth, MS Candidate 1 ; Stan Huff, MD 1,2 ;Scott Narus , PhD 1 ; Lucy Savitz, PhD, MBA 1,2 1 University of Utah, Salt Lake City, UT, 2 Intermountain Healthcare, Salt Lake City, UT.

E N D
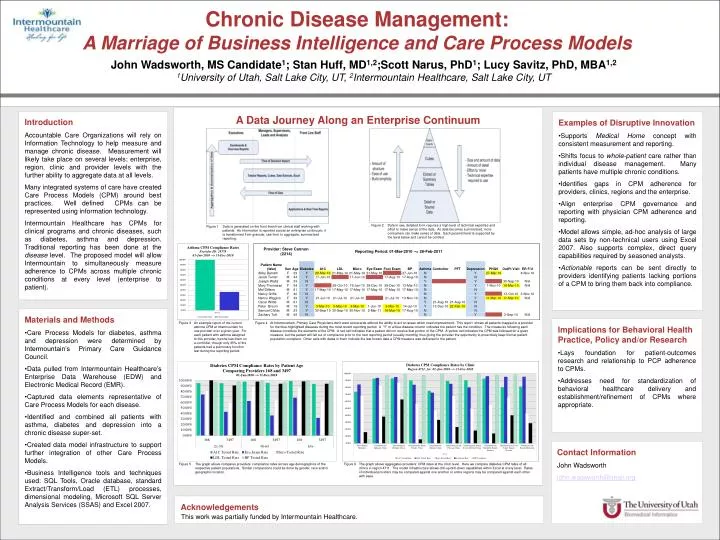
Chronic Disease Management: A Marriage of Business Intelligence and Care Process Models • John Wadsworth, MS Candidate1; Stan Huff, MD1,2;Scott Narus, PhD1; Lucy Savitz, PhD, MBA1,2 • 1University of Utah, Salt Lake City, UT, 2Intermountain Healthcare, Salt Lake City, UT A Data Journey Along an Enterprise Continuum Introduction Accountable Care Organizations will rely on Information Technology to help measure and manage chronic disease. Measurement will likely take place on several levels; enterprise, region, clinic and provider levels with the further ability to aggregate data at all levels. Many integrated systems of care have created Care Process Models (CPM) around best practices. Well defined CPMs can be represented using information technology. Intermountain Healthcare has CPMs for clinical programs and chronic diseases, such as diabetes, asthma and depression. Traditional reporting has been done at the disease level. The proposed model will allow Intermountain to simultaneously measure adherence to CPMs across multiple chronic conditions at every level (enterprise to patient). • Examples of Disruptive Innovation • Supports Medical Home concept with consistent measurement and reporting. • Shifts focus to whole-patient care rather than individual disease management. Many patients have multiple chronic conditions. • Identifies gaps in CPM adherence for providers, clinics, regions and the enterprise. • Align enterprise CPM governance and reporting with physician CPM adherence and reporting. • Model allows simple, ad-hoc analysis of large data sets by non-technical users using Excel 2007. Also supports complex, direct query capabilities required by seasoned analysts. • Actionable reports can be sent directly to providers identifying patients lacking portions of a CPM to bring them back into compliance. Figure 2 Data in raw, detailed form requires a high level of technical expertise and effort to make sense of the data. As data becomes summarized, more consumers can make sense of data. Each pyramid level is supported by the level below and cannot be omitted. Figure 1 Data is generated on the front lines from clinical staff working with patients. As information is reported across an enterprise continuum, it is transformed from granular, raw form to aggregate, summarized reporting. • Materials and Methods • Care Process Models for diabetes, asthma and depression were determined by Intermountain’s Primary Care Guidance Council. • Data pulled from Intermountain Healthcare’s Enterprise Data Warehouse (EDW) and Electronic Medical Record (EMR). • Captured data elements representative of Care Process Models for each disease. • Identified and combined all patients with asthma, diabetes and depression into a chronic disease super-set. • Created data model infrastructure to support further integration of other Care Process Models. • Business Intelligence tools and techniques used: SQL Tools, Oracle database, standard Extract/Transform/Load (ETL) processes, dimensional modeling, Microsoft SQL Server Analysis Services (SSAS) and Excel 2007. • Implications for Behavioral Health Practice, Policy and/or Research • Lays foundation for patient-outcomes research and relationship to PCP adherence to CPMs. • Addresses need for standardization of behavioral healthcare delivery and establishment/refinement of CPMs where appropriate. Figure 3 An example report of the current asthma CPM at Intermountain for one provider over a given year. For each patient with asthma assigned to this provider, he/she has them on a controller, though only 35% of the patients had a pulmonary function test during the reporting period. Figure 4 At Intermountain, Primary Care Physicians don’t want scorecards without the ability to act on areas which need improvement. This report shows all patients mapped to a provider for the blue-highlighted diseases during the most recent reporting period. A “Y” in a blue-disease column indicates the patient has the condition. The measures following each disease constitute the elements of the CPM. A red cell indicates that a patient did not receive that portion of the CPM. A yellow cell indicates the CPM was followed for a given measure, but the patient will fall out of compliance prior to the next reporting period (usually monthly) thus giving the provider the opportunity to proactively keep his/her patient population compliant. Other cells with dates in them indicate the last known date a CPM measure was delivered to the patient. Contact Information John Wadsworth john.wadsworth@imail.org Figure 5 The graph above compares providers’ compliance rates across age demographics of the respective patient populations. Similar comparisons could be done by gender, race and/or geographic location. Figure 6 The graph above aggregates providers’ CPM rates at the clinic level. Here we compare diabetes CPM rates of all clinics in region 4711. The model infrastructure allows drill-up/drill-down capabilities within Excel at every level. Rates of individual providers may be compared against one another or entire regions may be compared against each other with ease. Acknowledgements This work was partially funded by Intermountain Healthcare.