Download
1 / 49
510 likes | 856 Vues
Cognitive Biases in the Risk Matrix. William Siefert, M.S. Eric D. Smith Boeing Systems Engineering Graduate Program Missouri University of Science and Technology erics@mst.edu © 2007 Smith William Siefert, M.S.

E N D
Cognitive Biases in theRisk Matrix William Siefert, M.S. Eric D. Smith Boeing Systems Engineering Graduate Program Missouri University of Science and Technology erics@mst.edu © 2007 Smith William Siefert, M.S.
“Fear of harm ought to be proportional not merely to the gravity of the harm, but also to the probability of the event.” Logic, or the Art of Thinking Antoine Arnould, 1662 Consequence x Likelihood = Risk
Risk graphing iso-risk lines Hyperbolic curves Hyperbolic curves in log-log graph
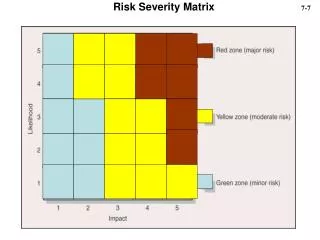
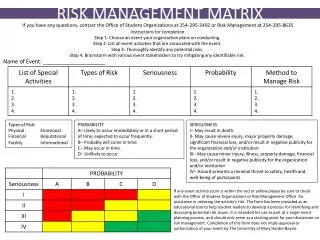
5 x 5 Risk “Cube” Objective vs. Subjective data Original Current "Campfire conversation" piece
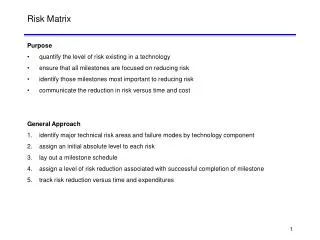
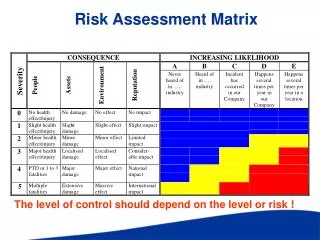
Present Situation • Risk matrices are recognized by industry as the best way to: • consistently quantify risks, as part of a • repeatable and quantifiable risk management process • Risk matrices involve human: • Numerical judgment • Calibration – location, gradation • Rounding, Censoring • Data updating • often approached with under confidence • often distrusted by decision makers
Goal • Risk Management improvement and better use of the risk matrix • Confidence in correct assessment of probability and value • Avoidance of specific mistakes • Recommended actions
Heuristics and Biases Daniel Kahneman won the Nobel Prize in Economics in 2002 "for having integrated insights from psychological research into economic science, especially concerning human judgment and decision-making under uncertainty.“ Similarities between cognitive bias experiments and the risk matrix axes show that risk matrices are susceptible to human biases.
Anchoring • First impression dominates all further thought • 1-100 wheel of fortune spun • Number of African nations in the United Nations? • Small number, like 12, the subjects underestimated • Large number, like 92, the subjects overestimated • Obviating expert opinion • The analyst holds a circular belief that expert opinion or review is not necessary because no evidence for the need of expert opinion is present.
Heuristics and Biases Presence of cognitive biases – even in extensive and vetted analyses – can never be ruled out. Innate human biases, and exterior circumstances, such as the framing or context of a question, can compromise estimates, judgments and decisions. It is important to note that subjects often maintain a strong sense that they are acting rationally while exhibiting biases.
5 x 5 Risk “Cube” Original Objective vs. Subjective data "Campfire conversation" piece
Likelihood • Frequencyof occurrence is objective, discrete • Probability is continuous, fiction • "Humans judge probabilities poorly" [Cosmides and Tooby, 1996] • Likelihood is a subjective judgment (unless mathematical) • 'Exposure' by project manager • timeless
Consequence, C • Objective Consequence determination is costly • Range of consequence • Total life-cycle cost • Mil-Std 882d
Case Study • Industry risk matrix data • 1412 original and current risk points (665) • Time of first entry known • Time of last update known • Cost, Schedule and Technical known • Subject matter not known • Biases revealed • Likelihood and consequence judgment
Magnitude vs. Reliability [Griffin and Tversky, 1992] • Magnitude perceived more valid • Data with outstanding magnitudes but poor reliability are likely to be chosen and used • Suggestion: • Data with uniform source reliability • Speciousness of data • Observation: risk matrices are magnitude driven, without regard to reliability
Expected Distribution for original risk points in Risk Matrix? Uniform: Bivariate Normal
1. Estimation in a Pre-Define Scale Bias • Response scale effects judgment [Schwarz, 1990] • Two questions, random 50% of subjects: • Please estimate the average number of hours you watch television per week: ____ ____ __X_ ____ ____ ____ 1-4 5-8 9-12 13-16 17-20 More • Please estimate the average number of hours you watch television per week: ____ ____ __X_ ____ ____ ____ 1-2 3-4 5-6 7-8 9-10 More
H0 = Normal Χ2 >~ 10 reject H0 (Χ2 = 22, Logistic
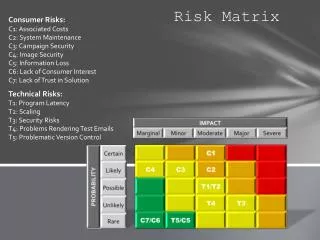
Effect of Estimation in a Pre-Defined Scale ‘People estimate probabilities poorly’ [Cosmides and Tooby, 1996] Consequence/Severity amplifiers
Effect of Estimation in a Pre-Defined Scale ‘People estimate probabilities poorly’ [Cosmides and Tooby, 1996] Consequence/Severity amplifiers
Severity Amplifiers • Lack of control • Lack of choice • Lack of trust • Lack of warning • Lack of understanding • Manmade • Newness • Dreadfulness • Personalization • Recallability • Imminency
Situation assessment • 5 x 5 Risk Matrices seek to increase risk estimation consistency • Hypothesis: Cognitive Bias information can help improve the validity and sensitivity of risk matrix analysis
Prospect Theory • Decision-making described with subjective assessment of: • Probabilities • Values • and combinations in gambles • Prospect Theory breaks subjective decision making into: • preliminary ‘screening’ stage, • probabilities and values are subjectively assessed • secondary ‘evaluation’ stage • combines the subjective probabilities and utilities
Subjective Probability, π(p) • small probabilities overestimated • large probabilities underestimated π(p) = ( pδ) / [pδ + (1- p)δ] (1/ δ) p = objective prob. 0 < δ ≤ 1 When δ =1, π(p) = p = objective probability usual value for δ: δ = 0.69 for losses δ = 0.61 for gains
Subjective Utility • Values considered from reference point established by the subject’s wealth and perspective • Framing • Gains and losses are subjectively valued • 1-to-2 ratio. • For gains: U+(v) = Ln(1 + v) • For losses: U-(v) = -(μ)Ln(1 – cv) μ = 2.5 c = constant v = objective value
ANALYSES AND OBSERVATIONS OF INITIAL DATA Impediments for the appearance of cognitive biases in the industry data: • Industry data are granular while the predictions of Prospect Theory are for continuous data • Qualitative descriptions of 5 ranges of likelihood and consequence • non-linear influence in the placement of risk datum points Nevertheless, the evidence of cognitive biases emerges from the data
2. Diagonal Bias • Anticipation of later moving of risk points toward the origin • Risk points withdrawn from the origin upward and rightward along the diagonal
3. Probability Centering Bias • Likelihoods are pushed toward L = 3 • Symmetric to a first order
3a. Asymmetrical Probability Bias • Subjective probability transformation • π(p) predicts that likelihood data will be pushed toward L = 3 • Large probabilities translated down more than small probabilities are translated up • Reduced amount of large subjective probabilities, comparatively
4. Consequence Bias • Consequence is pushed higher • Engineer identifies with increased risk to entire corporation • 'Personal' corporate risk
Statistical Evidence for Consequence Bias Max at C = 4 C = 1 significantly less than C = 5 counts C = 2 significantly less than C = 4 Consequence smoothed H0 = Normal Consequence increased, → , by Amplifiers Normal distribution comparison: χ2 = 600, df = 4 0.0 probability
Likelihood mitigation recommendations • Engineers and Management • Technical risk highest priority • Schedule risk communicated well by management • Cost risk likelihood less frequently communicated by management. • Higher cognizance of cost risk will be valuable at the engineering level
Consequence Mitigation • Engineers: • Schedule consequences effect careers • Technical consequences effect job performance reviews • Cost consequences are remote and associated with management • Higher cognizance of cost risk will be valuable at the engineering level
CONCLUSION • First time that the effects of cognitive biases have been documented within the risk matrix • Clear evidence that probability and value translations, as likelihood and consequence judgments, are present in industry risk matrix data • Steps • 1) the translations were predicted by prospect theory, 2) historical data confirmed predictions • Risk matrices are not objective number grids • Subjective, albeit useful, means to verify that risk items have received risk-mitigating attention.
Data Collection Improvements • Continuum of data from • Risk management to • (Issue management) • Opportunity management • Different databases • years of data in each • Time • Waterfall Risk charts
Suggestions for risk management improvement • Objective basis of risk: • Frequency data for Probability • $ for Consequence • Long-term, institutional rationality • Team approach • Iterations • Public review • Expert review • Biases and errors awareness
Future work • Confirmation of the presence of • probability biases, and • value biases in • risk data from other industries or companies • Real world effects on industry from using biased risk mitigation data • $’s, not risk points • Sequential ramifications • Prospect Theory risk gambles • Inform decision makers about how cognitive biases affect risk assessment
References • L. Cosmides, and J. Tooby, Are humans good intuitive statisticians after all? Rethinking some conclusions from the literature on judgment under uncertainty, Cognition 58 (1996), 1-73. • D. Kahneman, and A. Tversky, Prospect theory: An analysis of decision under risk, Econometrica 46(2) (1979), 171-185. • Nobel, "The Bank of Sweden Prize in Economic Sciences in memory of Alfred Nobel 2002," 2002. Retrieved March, 2006 from Nobel Foundation: http://nobelprize.org/economics/laureates/2002/index.html. • N. Schwarz, Assessing frequency reports of mundane behaviors: Contributions of cognitive psychology to questionaire construction, Review of Personality and Social Psychology 11 (1990), 98-119. • A. Tversky, and D. Kahneman, Advances in prospect theory: Cumulative representation of uncertainty, Journal of Risk and Uncertainty 5 (1992), 297-323.
Comments ! • Questions ?