Download
1 / 34
340 likes | 671 Vues
i247: Information Visualization and Presentation Marti Hearst . Types of Graphs and Visualizations January 28, 2008. Course Goals. Students will be able to: Describe the key design guidelines and techniques for visual display of information, including the relationship to human perception.

E N D
i247: Information Visualization and PresentationMarti Hearst Types of Graphs and Visualizations January 28, 2008
Course Goals Students will be able to: • Describe the key design guidelines and techniques for visual display of information, including the relationship to human perception. • Design interactive visualizations to support thought, understanding, and insight, using real data. • Explore and critically evaluate visualization techniques and applications. Adapted from Stone & Zellweger
Graphs Charts Maps Diagrams Types of Symbolic Displays (Kosslyn 89)
Types of Symbolic Displays • Graphs • at least two scales required • values associated by a symmetric “paired with” relation • Examples: scatter-plot, bar-chart, layer-graph
Types of Symbolic Displays • Charts • discrete relations among discrete entities • structure relates entities to one another • lines and relative position serve as links • Examples: • Family tree • Flow chart • Network diagram
Types of Symbolic Displays • Maps • Internal relations determined (in part) by the spatial relations of what is pictured • Labels paired with locations • Examples: • Map of census data • Topographic maps
Types of Symbolic Displays • Diagrams • Schematic pictures of objects or entities • Parts are symbolic (unlike photographs) • how-to illustrations • figures in a manual From Glietman, Henry. Psychology. W.W. Norton and Company, Inc. New York, 1995
What is the “real” taxonomy for visual representations? • An empirical investigation by Lohse et al.’94 • (Only used static, 2D graphics) • 16 participants • Half had a graphic design background • First, looked at 60 images and scored them along 10 scales. • These were used to compute statistical similarity • Then, organized the 60 images into categories according to similarity. • Were asked to name the groups • Then they grouped these into higher-level groups, repeatedly, until they were in one large group. Lohse, G L; Biolsi, K; Walker, N and H H Rueter, A Classification of Visual Representations, CACM, Vol. 37, No. 12, pp 36-49, 1994
Scales that Participants Used(and percentage of variance explained) 16.0 emphasizes whole – parts 11.3 spatial – nonspatial 10.6 static structure – dynamic structure 10.5 continuous – discrete 10.3 attractive – unattractive 10.1 nontemporal – temporal 9.9 concrete – abstract 9.6 hard to understand – easy 9.5 nonnumeric – numeric 2.2 conveys a lot of info – conveys little
Resulting Categories (Lohse et al. 94) • Graphs • Tables (numerical) • Tables (graphical) • Charts (time) • Charts (network) • Diagrams (structure) • Diagrams (network) • Maps • Cartograms • Icons • Photo-realistic images
Graphs • Encode quantitative information using position and magnitude of geometric objects. • Examples: scatter plots, bar charts.
Tables • An arrangement of words, numbers, signs, or combinations of them to exhibit a set of facts or relationships in a compact fashion. • Less abstract symbolic notation than graphs. • Graphical tables and numerical tables
Time Charts • Display temporal data. • Gantt chart, time schedule.
Network Charts • Show the relationships among components • Symbols indicate the presence or absence of components. • Correspondences are shown by lines, arrows, proximity, similarity, or containment. • Flow charts, org charts, pert charts, decision trees.
Structure Diagrams • A static description of a physical object. • Spatial layout expresses true coordinate dimensions of the object. • Cross-sections
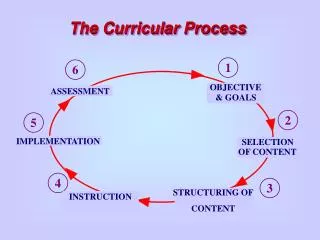
Process Diagrams • Describe interrelationships and processes associated with physical objects. • Spatial layout expresses dynamic, continuous, or temporal relationships among the objects. • Lifecycle
Maps • Symbolic representations of physical geography. • Marine charts, topo maps, projections of world maps. • Differ from cartograms in that cartograms super-impose quantitative data over a base map.
Cartograms • Spatial maps that show quantitative data. • Show more quantitative information than structure diagrams. • Chloropleths, dot maps, flow maps.
Icons • Impart a single interpretation or meaning for a picture; a unique label for a visual representation.
Photo-realistic Pictures • Realistic images of an object or scene.
Put into Multiple Categories • No real agreement on these.
Other Findings (Lohse et al. 94) • Photorealistic images were least informative • Echos results in icon studies – better to use less complex, more schematic images • Graphs and tables are the most self-similar categories • Results in the literature comparing these are inconclusive • Cartograms were hard to understand • Echos other results – better to put points into a framed rectangle to aid spatial perception • Temporal data more difficult to show than cyclic data • Recommend using animation for temporal data
The NYTimes Illustrates Climate Change • Cartoon • Illustrative Photograph • Graph • Graph (multiple views) • Interactive Graphs • Combination of Photo Illustration, Drawn Illustration, Information Graphics • Video
The NYTimes Illustrates Climate Change • Cartoon • Carbon Neutral Confession • April 28, 2007 • Ron Barrett • NYTimes • http://www.nytimes.com/2007/04/29/weekinreview/29revkin.html?scp=11&sq=global+warming&st=nyt
The NYTimes Illustrates Climate Change • Illustrative Photograph • A Disaster Epic (in Slo-Mo) • February 4, 2007 • Macdiarmid/Getty Images • http://www.nytimes.com/2007/02/04/weekinreview/04basic.html?scp=9&sq=global+warming&st=nyt
The NYTimes Illustrates Climate Change • Information Visualization Graphic • Carbon Dioxide in the atmosphere • April 23, 2006 • Bill Marsh • NYTimes • http://www.nytimes.com/imagepages/2006/04/23/weekinreview/20060423revkin_graphic.html • http://www.nytimes.com/2006/04/23/weekinreview/23revkin.html
The NYTimes Illustrates Climate Change • Static Graphic (Multiple Views) • Far Down the List of Worries • (from the story Yelling 'Fire' on a Hot Planet by Revkin) • April 23, 2006 • NYTimes • Bill Marsh • http://www.nytimes.com/imagepages/2006/04/23/weekinreview/20060423revkin2_graph.html
The NYTimes Illustrates Climate Change • Combination: Photo Illustration, Drawn Illustration, Information Graphics • A Battle Between the Bottle and the Tap • July 15, 2007 • Bill Marsh, Tony Cenicola • Satisfying the National Thirst ... With Lots of Bottles • http://www.nytimes.com/2007/07/15/weekinreview/15marsh.html?scp=54&sq=global+warming&st=nyt
The NYTimes Illustrates Climate Change • Graphic • A Carbon Tide: Past, Present, and Future • Bill Marsh • December 16, 2007 • NYTimes • http://www.nytimes.com/interactive/2007/12/16/weekinreview/20071216_EMISSIONS_GRAPHIC.html
The NYTimes Illustrates Climate Change • Interactive flash graphics • October 1, 2007 • Sea Ice in Retreat • Aigner, Corum, Nguyen • NYTimes • http://www.nytimes.com/interactive/2007/10/01/science/20071002_ARCTIC_GRAPHIC.html • http://topics.nytimes.com/top/news/science/topics/globalwarming/index.html
The NYTimes Illustrates Climate Change • Video • Solar City: A Co-op Goes Green • January 23, 2008 • Dwyer, Romero, Witty • NY Times • http://video.on.nytimes.com/?fr_story=aa81e9284c77f01e48353c64b86fa7a0a21e887f