Download
1 / 66
660 likes | 1.11k Vues
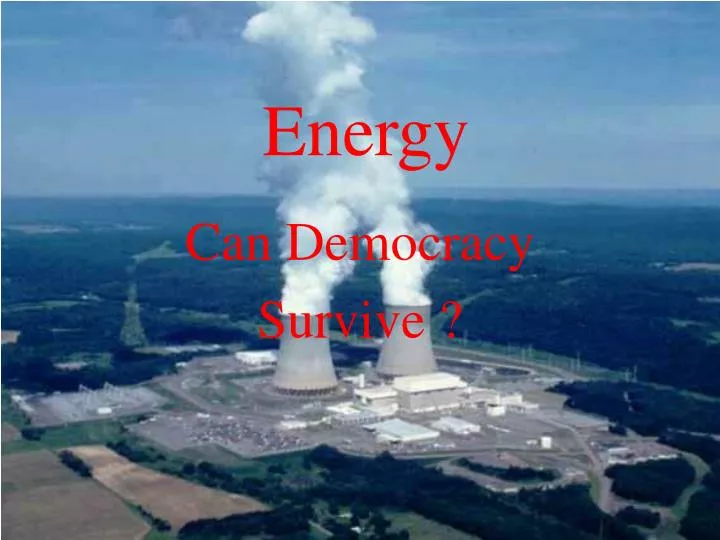
Energy Can Democracy Survive ? Temperature & CO 2 over 450,000 years C ontributions of greenhouse gases to Global Warming Worldwide. Carbon Dioxide CO 2 66% Methane CH 4 18% Chlorfluocarbons CFCs 11% NOx & others 5% source IPPC

E N D
Energy Can Democracy Survive ?
Contributions of greenhouse gases to Global WarmingWorldwide. • Carbon Dioxide CO266% • MethaneCH4 18% • Chlorfluocarbons CFCs11% • NOx & others 5% source IPPC
Characteristics of Kyoto Greenhouse Gases(Stern Report III) Non-CO2 Kyotogases make up around one quarter of total emissions in terms of their long term warmingpotential in 2000 (Table 3.1). However, they account for around 30% of the total warmingeffect (the radiative forcing) of non-CO2 gases in the atmosphere today.
The Challenge60% reduction of World 1990 emissions of CO2 by 2050 "Annex I Countries" are those that have taken on emission reduction or limitation targets under the Kyoto Protocol
Stabilising Global Emissions (Stern Report IV) To stabilise at 550 ppm CO2equivalent, global emissions would need to peak in the next 10 – 20years and then fall by around 1 – 3% per year. Depending on the exact trajectory taken,global emissions would need to bearound 25% lower than current levels by 2050, oraround 30-35 Gt CO2. Stabilising at 450 ppm CO2 e or below, without overshooting, is likely to be very costlybecause it would require around 7% per year emission reductions.
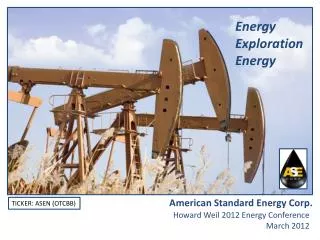
Oil Prices and Resources (Stern Report III) There appears to be no good reason, then, to expect large increases in real fossil-fuel prices to be necessary to bring forth supply. Yet big increases in price would be required to hold energydemand and emissions growth in check if no other method were also available. Stern Report
Where do they come from? 65% of UK CO2 emissions are energy derived(Stern Report part III)
Public attitudes to climate change around the world(Source Stern Report IV)
Emissions of CO2 from fuel supplied by the UK to international air & sea transport1990-2005
Reducing Emissions What can we do ?
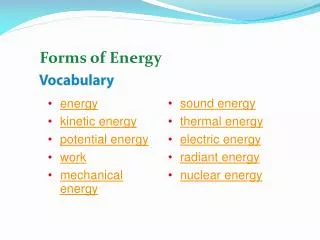
What are the solutions? • Above all save energy • Nuclear – Fission reactors are already demonstrated as viable and safe but deep concerns over the potential proliferation of nucflear arms • Biofuels – the old solution – they will never do more than scratch the surface and plant resources will mostly be needed for food. • Hydrogen – where does it come from. If from nuclear or fossil fuel the problem is just being displaced with alower overall efficiency. • Geothermal – technology is here but needs rapid expansion • Wind – technology is here is expanding but is opportunist • Photovoltaic - technology is under rapid development and is expanding from a small base
Reducing Emissions What can we do ? Save Energy
How to save energy?Two examples Housing • Insulation and more efficient heating of property • Turn down the thermosat A reduction of 1°C makes a 10% saving in fuel. We now heat to 20°C but 16.5% C was the design T in 1960’s. • Replace all electrical bulbs with energy saving bulbs. Transport • Use public transport
Home Insulation in the UK – an imperfect market • Only 30% of homes have their roofs insulated • Insulating Roof Cost £ 250 • Insulating Walls Cost £ 500 • Savings 60% losses (£ 500/year) • CO2 reduction - 10% of national emissions • Persons over 60 receive £200 to help pay fuel bills or up to £300 if they are over 80. Imperfections of the market • A short term tenant has no interest in insulating he pays the cost and gets no benefit. • An owner of a rented property has no interest in insulating he pays the cost and gets no benefit.
Why not use public transport?- 1 This diagram is for 20,000 km/year At 10,000 km/year the standing charge is 80% The running costs are only 20%.
Why not use public transport?– 2 The less you use your car the more it costs/km Freedom - it is convenient and flexible Personal safety – protection from mugging, theft & assaults With larger numbers in the car the costs per person plummet Prestige, a car is seen as a trophy of success in life
Electricity demand – The Consumer is king - 1 The highest demand ever recorded on the National Grid system was 54.430 GW in the half hour ending 17:30hrs on 10th December 2002.
Electricity demand – The Consumer is king - 2 At the half-time interval in the Englang Germany football match demand rose by 1,200 Mw in less than 5 minutes due to people making hot drinks. This would require several large power stations to go from half to full power.
Impact of the EU refrigerator energy label - sales of refrigerators in the EU by energy label class, 1992-2003 (Stern IV)
Reducing Emissions What can we do ? Alternative Fuels
Environmentally-compatible primary bioenergy potential in the EU (source EEA) The agricultural potential comprises dedicated bioenergy crops plus cuttings from grassland and was calculated for EU-25without Cyprus, Luxembourg and MaltaThe forestry potential consists of residues from fellings and complementary fellings.
Land available for biomass production for energy(Source EEA)
Environmentally-compatible agricultural bioenergy potential(EEA)
Environmentally-compatible primary bioenergy potential in the EU(Source EEA) • Biofuels made from sugar and vegetable oils will not substantially reduce our dependance on oil • Production of conventional transport fuels uses only the starch or oil parts of limited number of crops and operates on reduced efficiency compared to whole-plant uses. • The use of grain for biofuel is already increasing food prices. The extent to which a substitution offood production is desirable needs to be discussedwithin society. • To meet the EU target of 5.75% of transport fuel by 2010 by biofuels from domestic production would imply the use of between 4 and 13% of Europe’s agricultural area.
Anaerobic Digesters (Source Stern Report) • Anaerobic digesters store manure and allow it to decay in the absence of oxygen, producing biogas (a mixture of methane and CO2) which can be captured and combusted as an alternative to fossil fuels. • In the US, the AgSTAR programme encouraged the adoption of this technology • In the last two years, the number of digesters in the US has more than doubled, reducing emissions by 0.6 MtCO2e annually and generating 120 million kWh of energy
1 Electrolysis of water. Electricity has to be produced from either 1a Atomic energy - 30% efficiency 1b Photovoltaic – 8% efficiency 2 Decomposition of a fossil fuel - hydrogen content Methane 25% Oil 12.5% Coal <5% The Hydrogen Myth - 1Hydrogen does not exist naturally- where does it come from?
1 litre methane contains three times as much energy as 1litre of hydrogen Hydrogen is not liquefiable except at cryogenic temperatures Transport and use in vehicles is very difficult 100 litres hydrogen is the energy equivalent of 1 litre petrol Storage at 100 bar (Atmos) to occupy the same volume as petrol There is 10% loss of energy to compress it to 100bar Current oil consumption 30,000,000,000 barrels of oil/ year Hydrogen heat equivalent 15,900,000,000,000 cubic metres at stp To produce this by water electrolysis requires 4,033,485,540 m² of electrode Only Platinum and other precious metals have yet been found to be suitable as electrodes The Hydrogen Myth - 2
Reducing Emissions What can we do ? Non Fuel Energy Sources
World electrical energy - Sources In electricity generation, renewables are the third most important source of energy after coal and gas, providing 18% of total electricity in 2003.
Reducing Emissions What is the target?
60% reduction of World 1990 emissions of CO2 by 2050 "Annex I Countries" are those that have taken on emission reduction or limitation targets under the Kyoto Protocol
Historical and forecast EU oil production Source - Center for Energy and Environmental Policy
Historical and forecast US oil production Source - Center for Energy and Environmental Policy