Download
1 / 60
600 likes | 973 Vues
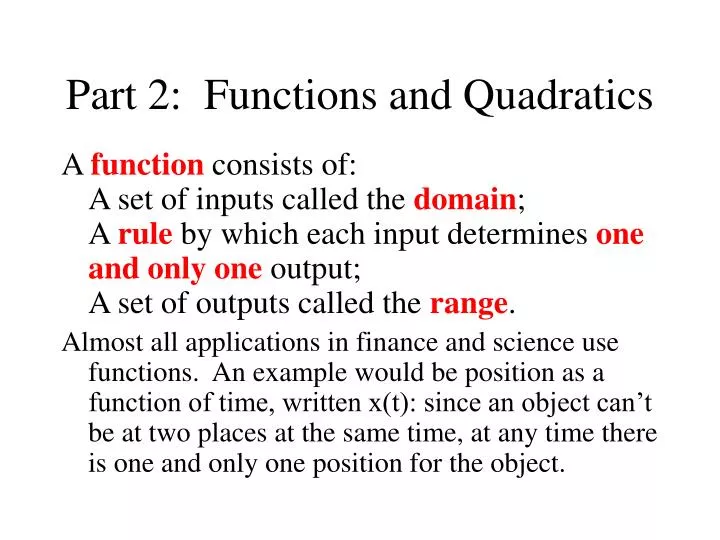
Part 2: Functions and Quadratics A function consists of: A set of inputs called the domain ; A rule by which each input determines one and only one output; A set of outputs called the range .

E N D
Part 2: Functions and Quadratics A function consists of:A set of inputs called the domain;A rule by which each input determines one and only one output;A set of outputs called the range. Almost all applications in finance and science use functions. An example would be position as a function of time, written x(t): since an object can’t be at two places at the same time, at any time there is one and only one position for the object.
Functions - definition Functions can often be expressed in equations. Example: x(t) = xo + vo*t + ½*g*t2 , which is the equation for the position of an object undergoing constant acceleration. The parameters xo, vo, and g are constants. Note that for every t, there is one and only one value for x, so x is a function of t. Counter-example for functions: from the above, we can express t in terms of x (the inverse relation): t = {-vo± SQRT[vo2 – 4(½*g)(xo-x)]}/2((½*g)Note that there is a possibility of an object being at the same place at more than one time, so t is NOT a function of x.
Functions - definition When you graph a function y(x) on your calculator, you will use y for the output (also called the dependent variable) and x for the input (also called the independent variable). If you graph the equation x(t) = xo + vo*t + ½*g*t2 ,it will look roughly likethe drawing on the rightwith t being the x, andx being the y. x t
Functions - definition Note in this graph that we can see that there is only one value of x for each value of t- look at the green vertical line.. Also note in this graph that we can see that there are two values of t for each value of x – look at the blue horizontal line. x t
Functions - definition How about our linear equation: y = mx + b. Can we say that y is a function of x, y(x)? For the inverse linear relation, can we say that x is a function of y, x(y)?
Functions - definition How about our linear equation: y = mx + b. Can we say that y is a function of x, y(x)?Yes, since for every value of x there is one and only one value for y. Can we say that x is a function of y, x(y)?Solving our linear equation for x gives: x = (1/m)y – b/m. Yes, x(y) is a function since for every value of y there is one and only one value for x.
Functions - domain The formal definition of a domain is:Unless specific information to the contrary is given, the domain of a function, f, includes every real number (input) for which the equation (rule) produces a real number as output. Normally when we think in terms of math, x and y don’t have any limits since real numbers can extend to infinity. However, there are situations that we need to consider, such as the equation (rule) giving us square roots of negative numbers which are NOT real numbers.
Functions – domain Example: Consider the function y(x) = √[(x-4)2 - 25] Is x=3 in the domain for the function? What would the domain for this function be?
Functions – domain (example continued) y(x) = √[(x-4)2 - 25] Is x=3 in the domain? NO, since (3-4)2 – 25 = -24, and the square root of a negative number is not a real number. For the function to return a real number, (x-4)2≥ 25, or |x-4| ≥ 5, or x ≥ 9 and x ≤ -1.
Functions - domain However, in financial and physical terms, particular relations (including functions) apply only under limited circumstances. This is where the domain part of the function definition comes into play. One example is the force of gravity: F(r) = GMm/r2. Note that F(r) is not defined when r=0. In physics terms mass takes up space, so two masses can’t have zero distance between them since they both can’t occupy the same space at the same time.
Functions - domain Example: When you throw an object upward on the earth, gravity pulls it back down. If we ignore the effects of air resistance, we get the following function for x(t): x(t) = xo + vo*t + ½*g*t2 .However, this function only applies while the object is in the air. It does NOT apply to before it is thrown, and it does NOT apply for after it hits the ground. Thus the time for which this equation is valid is limited. Time is the independent variable and so this equation has a limited domain.
Functions – domain The concept of domain is helpful when we define a function that has different behaviors during different intervals. Such a function is called a piecewise-defined function. Example of a piecewise-defined function: A car accelerates from rest for 5 seconds at a rate of 4 m/s2, and then continues on at a constant velocity for 20 more seconds. Find the function for position versus time.
Functions – domain For the first part of the problem, we need to use the formula for constant acceleration:x(t) = xo + vo*t + ½*a*t2 where xo=0, vo=0 and a=4 m/s2 . This applies for 0 sec. ≤ t ≤ 5 sec. After this, the car continues on at a constant speed (which is determined from v5 = vo + a*t = 20 m/s), so x(t) = x5 + v5*t, and this applies for 5 sec ≤ t ≤ 20 sec. Note that after 5 seconds, x(5 sec) = x5 = ½*(4 m/s2)*(5 sec)2 = 50 m
Functions – domain (example continued from previous slide) Therefore our function of position versus time is: x(t) = (2 m/s2)t2for 0 sec ≤ t ≤ 5 secx(t) = (50 m) + (20 m/s)(t - 5sec)for 5 sec ≤ t ≤ 20 sec X (m) 150 50 5 15 T (sec)
Functions – rate of change Sometimes we are interested in more than just a value that a function provides. We are interested in how much that value changes when we change the independent variable. This concept has a name: rate of change. The definition of an average rate of change for a function is simply: [y(x2) – y(x1)] / [x2 – x1]
Functions – rate of change Example: x(t) = (501 m) + (20 m/s)*t We recognize this as a linear function of position with respect to time (moving at constant speed). The average speed of the object is its average rate of change of distance during a specified time interval. The average speed between t=5 sec and t=6 sec in this case is: v5-6 = [x(6 sec) – x(5 sec)] / [(6 sec) – (5 sec)] = [(501 m + 120 m) – (501 m +100 m)] / [1 sec] = 20 m/s . Note that the constant term, 501 m, does not figure into the rate of change. Also note that in this case the slope of the line, 20 m/s, equals the average rate of change, 20 m/s. Is this a coincidence, or is it true in general?
Functions – rate of change It is easy to see that for a linear function, the slope is constant, and so the average rate of change will also be a constant, and that constant will be the same as the slope. Average rate of change =[y(x2) – y(x1)] / (x2 – x1) = Δy/Δx, and Slope = m = (y2 – y1) / (x2 – x1)= Δy/Δx. For other functions, though, the slopes are not constant, and so the average rates of change also are not constant.
Functions – rate of change From a graphical point of view, the average rate of change between x2 and x1: [y(x2) – y(x1)] / (x2 – x1) = Δy/Δx is the slope of the straight line that goes through the two points (x2, y2) and (x1, y1). This line has a particular name, called the secant line for those two points.
Functions – rate of change A useful special case of the average rate of change of a function is called thedifference quotient, and it is defined as: [y(x+h) – y(x)] / [(x+h) – x] Or more simply: [y(x+h) – y(x)] / h This will be a tool that will be used in calculus, but it is also a tool we can use now.
Functions – rate of change difference quotient: [y(x+h) – y(x)] / h Example: Consider the difference quotient (which is the average rate of change between a point and a near point) for y(x) = ax2 + bx + c. In this case, we have: [{a(x+h)2 + b(x+h) + c} – {ax2 + bx + c}] / h = [ax2 + 2axh + ah2 + bx + bh + c – ax2 – bx - c] / h = 2ax + b + ah. As h becomes very small, the term (ah) also becomes very small, and the average rate of change of this function near x is approximately 2ax + b.
Functions – rate of change The rate of change for y(x) = ax2 + bx + cnear x is approximately 2ax + b. Note that the constant, c, does not figure into the change (as we should expect). Note that the bx term gives a constant rate of change, b. Note that the ax2 term gives a rate of change ≈ 2ax. Note that this term has a rate of change that approximately depends on the independent variable, x. As x increases, the rate of change increases. This should sound plausible since the x2 term goes up much faster the larger x is.
Functions – rate of change Example: For an object that is falling due to gravity without any air resistance, we know that the object picks up downward speed with time: v(t) = vo + (-g)*t . But we know that speed is the rate of change of position. The result from the previous slide suggests that the position as a function of time should be a quadratic of the form x(t) = xo + vot + ½(-g)t2 , and this turns out to be correct.
Quadratic Functions Definition of a quadratic function is: y(x) = ax2 + bx + c where a ≠ 0 . The graph of a quadratic function is called a parabola. The lowest point on an upward opening parabola, or the highest point on a downward opening parabola is called its vertex. The vertical line through the vertex, which is a line of reflective symmetry, is called its axis.
Quadratic Functions y(x) = ax2 + bx + c To begin our analysis, we note that the x2 term will dominate for large values of x, and so we see that the constant, a, will tell us which way the parabola opens up. If a is positive, the parabola opens upwards. If a is negative, it opens downward. Try this on your graphing calculator to verify.
Quadratic Functions y(x) = ax2 + bx + c Another thing that a does is to determine how fast the parabola rises (or falls). The larger the absolute value of a is, the quicker the parabola rises (or falls), and the narrower the parabola is. Now we consider what the other constants do.
Quadratic Functions As we did when we investigated a circle, we will use the tool of “completing the square” to try to see what the constants b, and c do for the parabola. y(x) = ax2 + bx + c First, let’s take a outside: y = a[x2 + (b/a)x + c/a]Now let’s complete the square for x:y = a[x2 + (b/a)x + (b/2a)2 – (b/2a)2 + c/a](y – [c - b2/4a]) = a(x+b/2a)2
Quadratic Functions y(x) = ax2 + bx + c (y – [c - b2/4a]) = a(x+b/2a)2 We can identify the vertex as the point where we have 0 = 0 in the blue form, so xv = -b/2a , yv = [c-(b2/4a)] Verify this for yourself, by choosing values for a, b, and c, and then graphing this function on your calculator and identifying the vertex on your calculator.
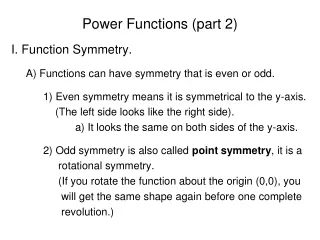
Even and Odd Functions We talked about symmetries earlier. The linear function did not have a symmetry except in the case of the y intercept being zero. In this case, f(x) = bx, the function is symmetric through the origin: f(-x) = -f(x). Functions with this particular symmetry are called odd functions. What about the function f(x) = ax2 ? We see that this function has a reflection symmetry about the vertical axis: f(x) = f(-x). Functions with this particular symmetry are called even functions.
Transformations By graphing functions, we can see how they look. This brings up the question of how can we make them look a little different. Can we move the graph up or down? Can we move the graph left or right? Can we “reflect” the graph across the horizontal or vertical axes? Can we stretch or contract the graph?
Transformations We’ve considered in depth both the linear and quadratic functions, so we have at least two functions to test our ideas with: linear: y = mx + b quadratic: y(x) = ax2 + bx + c , or(y – [c - b2/4a]) = a(x+b/2a)2 First: can we move the graph up or down?
Transformations linear: y = mx + b quadratic: y(x) = ax2 + bx + c , or(y – [c - b2/4a]) = a(x+b/2a)2 Can we move the graph up and down? If we add a constant, k, to the right side, we will make y that much bigger for each value of x. linear: y = mx + b+ k quadratic: y(x) = ax2 + bx + c + k
Transformations linear: y = mx + b+k quadratic: y(x) = ax2 + bx + c +k, or(y – [c - b2/4a]) = a(x+b/2a)2 +k We could also subtract that constant, k, from y wherever we see y:linear: (y –k) = mx + bquadratic: (y(x) – k) = ax2 + bx + c, or(y – [c - b2/4a] - k) = a(x+b/2a)2 Check this by trying this on your calculator.
Transformations Can we perform the same trick for moving things horizontally by adding or subtracting a constant, j, from x?
Transformations linear: y = m(x-j) + bquadratic: y(x) = a(x-j)2 + b(x-j) + c, or (y – [c - b2/4a]) = a(x+b/2a-j)2 Check this by trying this on your calculator.
Transformations Can we expand or contract how high (or low) the graph goes, or how compact or expanded the graph goes?
Transformations If we simply multiply the whole right side by a factor, p, we will make y bigger (or smaller) by that factor, f: linear: y = p(mx + b) quadratic: y(x) = p(ax2 + bx + c), or(y – p[c - b2/4a]) = ap(x+b/2a)2 Check this by trying this on your calculator.
Transformations Could we do the same thing for compressing or expanding in the horizontal direction: replacing every x with gx? Note that this would make x bigger (or smaller) by a factor of g, so if g>1 then gx>x. This would have the effect of compressing the horizontal rather than expanding it. Try it on your graphing calculator.
Inverse Functions When is an inverse relation an inverse function? Recalling that a function, y(x), has one and only one value of y for each value of x, we can see that any function that has a one-to-one relationship between x and y will also have a one-to-one relationship with y and x, and so the y(x) will have an inverse function x(y).
Inverse Functions Example: Since the linear function, y(x) = mx+b, has only one value of y for each value of x, and it has only one value of x for each value of y, this is a one-to-one relationship and so the linear function has a inverse function: x = (y-b)/m.
Inverse Functions Counter-example: A counter-example is the quadratic function: y(x) = ax2. There is only one value of y for each value of x (y is a function of x), but there are two values of x that give the same value for y (x and –x give the same y). Therefore, y(x) = ax2 is not a one-to-one relationship, and so x = ± SQRT(y/a) is not a function.
Computer Homework You should be able to do the fifth Computer Homework assignment on Quadratic Equations, Vol. 0, #4.
Regular Homework Set #5(continued on the next 2 pages) • a) Is y(x) = |x - a| a function?b) Graph it.c) If the relation is a function, is it an even or odd function or neither? • What is the domain for the function:y(x) = SQRT[(7-x)2 – 36] • Given the function: y(x) = 6x2 – 9, a) determine the inverse relation; b) is the inverse relation a function?c) explain your answer to part b.
Regular Homework Set #5(continued from previous page) 4. a) Graph the function of problem 3 above and make a drawing of it.b) Graph the inverse function of problem 2 if it exists; if not, restrict the relation so as to define a function and plot that function. 5. Water flows into an initially empty tank at the rate of 5 liters per minute for 10 minutes; the flow is suddenly reduced to 2 liters per minute and this continues for another 20 minutes.a) Write the function for the amount of water in the tank versus time.b) Draw a graph of this function.
Regular Homework Set #5(continued from previous page) 6. Given the function y(x) = 2x3 – 7x, find an expression for the difference quotient. 7. For the quadratic function: y(x) = -2x2 – 7x + 11, find the coordinates of the vertex. 8. For the parabola with vertex (-1,3) and a=1, express the quadratic function in the form: y(x) = ax2 + bx + c (that is, determine the constants a, b, and c).
Regular Homework Set #5(continued from previous page) 9) Is the function: y(x) = 7x3 –9x an even function, odd function, or neither. Explain your answer. 10) Express a quadratic function that is the same as y(x) = -2x2 – 7x + 11 (problem 7) but has a vertex that is moved to the right by 3 and down by 4.
Polynomial Functions What does y = mx + b look like?How many solutions are there for y=0 ? What does y = ax2 + bx + c look like?How many solutions are there for y=0 ? Can we generalize for higher degree polynomials?
Polynomial Functions Can we convert the function y = ax2 + bx + cinto the form: y = a(x-p)(x-q) ? Yes! When you do, you come up with the quadratic equation to give the values of p and q! This shows that when y=0, there are two solutions: x=p and x=q. Can we convert the function y = ax3 + bx2 + cx + d into the form y = a(x-p)(x-q)(x-r) ? It looks like we should be able to. This means that there are in general three solutions to this third order equation (for any value of y).
Polynomial Functions For the function y = ax2 + bx + c , as x gets very big (both positive and negative), how does y behave? Is this consistent with there being two solutions in general for each value of y? For the function y = ax3 + bx2 + cx + d , as x gets very big (both positive and negative), how does y behave? Is this consistent with there being three solutions in general for each value of y?
Polynomial Functions For the quadratic and the cubic and higher degree polynomials, we need to be aware of the possibility of having repeated roots. For example, y = ax3 + bx2 + cx + d in the form y = a(x-p)(x-q)(x-r) where p and q are the same, what would this graph look like? What about the case where p = q = r ?
Asymptotic Behavior What happens when the exponent of x becomes negative, such as y(x) = ax-1 = a/x? How does this function look, and how does it behave? What happens to y as x approaches zero? What happens to y as x approaches very large values? Does it every cross the x or the y axis? Does the function y(x) = a/(x-b) behave any differently than y(x) = a/x ?