Download
1 / 1
10 likes | 144 Vues
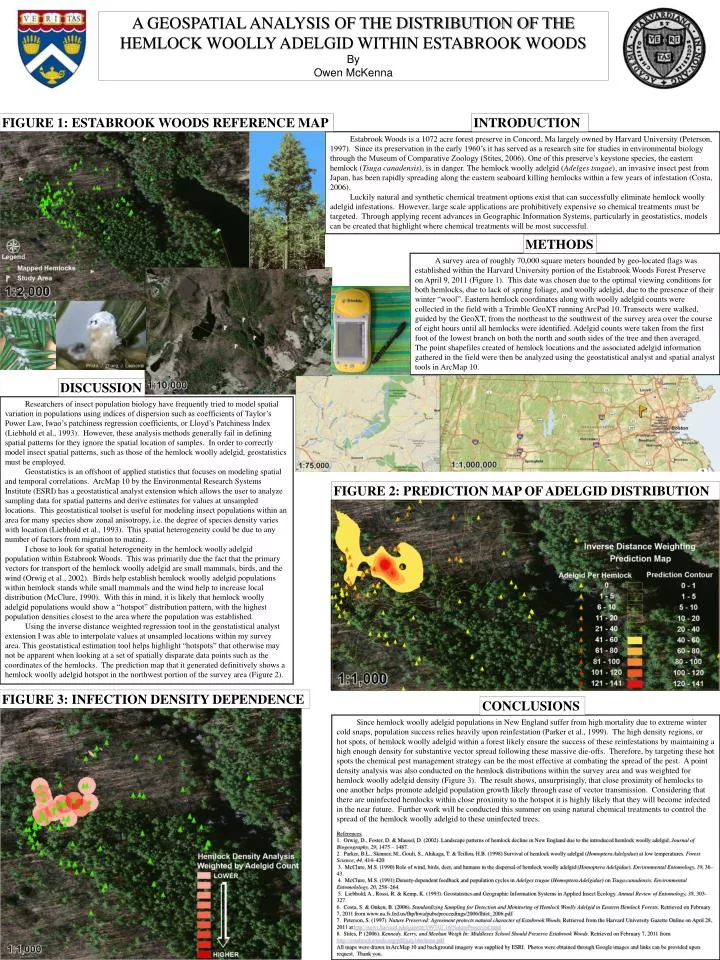
A GEOSPATIAL ANALYSIS OF THE DISTRIBUTION OF THE HEMLOCK WOOLLY ADELGID WITHIN ESTABROOK WOODS By Owen McKenna. FIGURE 1: ESTABROOK WOODS REFERENCE MAP. INTRODUCTION.

E N D
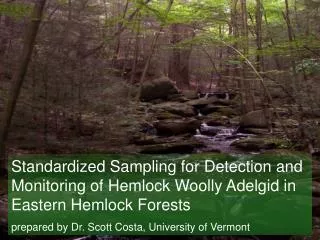
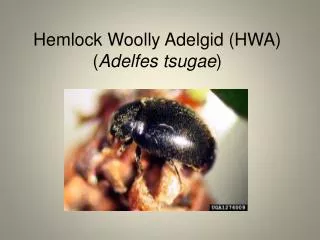
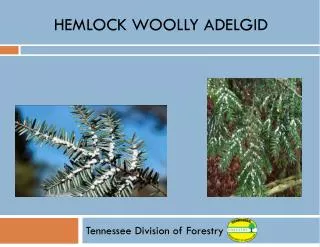
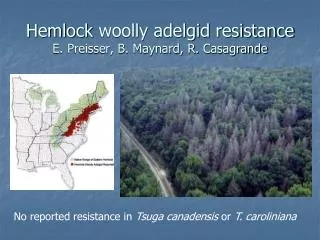
A GEOSPATIAL ANALYSIS OF THE DISTRIBUTION OF THE HEMLOCK WOOLLY ADELGID WITHIN ESTABROOK WOODS By Owen McKenna FIGURE 1: ESTABROOK WOODS REFERENCE MAP INTRODUCTION Estabrook Woods is a 1072 acre forest preserve in Concord, Ma largely owned by Harvard University (Peterson, 1997). Since its preservation in the early 1960’s it has served as a research site for studies in environmental biology through the Museum of Comparative Zoology (Stites, 2006). One of this preserve’s keystone species, the eastern hemlock (Tsuga canadensis), is in danger. The hemlock woolly adelgid (Adelges tsugae), an invasive insect pest from Japan, has been rapidly spreading along the eastern seaboard killing hemlocks within a few years of infestation (Costa, 2006). Luckily natural and synthetic chemical treatment options exist that can successfully eliminate hemlock woolly adelgid infestations. However, large scale applications are prohibitively expensive so chemical treatments must be targeted. Through applying recent advances in Geographic Information Systems, particularly in geostatistics, models can be created that highlight where chemical treatments will be most successful. METHODS A survey area of roughly 70,000 square meters bounded by geo-located flags was established within the Harvard University portion of the Estabrook Woods Forest Preserve on April 9, 2011 (Figure 1). This date was chosen due to the optimal viewing conditions for both hemlocks, due to lack of spring foliage, and woolly adelgid, due to the presence of their winter “wool”. Eastern hemlock coordinates along with woolly adelgid counts were collected in the field with a Trimble GeoXT running ArcPad 10. Transects were walked, guided by the GeoXT, from the northeast to the southwest of the survey area over the course of eight hours until all hemlocks were identified. Adelgid counts were taken from the first foot of the lowest branch on both the north and south sides of the tree and then averaged. The point shapefiles created of hemlock locations and the associated adelgid information gathered in the field were then be analyzed using the geostatistical analyst and spatial analyst tools in ArcMap 10. METHODS, DISCUSSION Researchers of insect population biology have frequently tried to model spatial variation in populations using indices of dispersion such as coefficients of Taylor’s Power Law, Iwao’s patchiness regression coefficients, or Lloyd’s Patchiness Index (Liebhold et al., 1993). However, these analysis methods generally fail in defining spatial patterns for they ignore the spatial location of samples. In order to correctly model insect spatial patterns, such as those of the hemlock woolly adelgid, geostatistics must be employed. Geostatistics is an offshoot of applied statistics that focuses on modeling spatial and temporal correlations. ArcMap 10 by the Environmental Research Systems Institute (ESRI) has a geostatistical analyst extension which allows the user to analyze sampling data for spatial patterns and derive estimates for values at unsampled locations. This geostatistical toolset is useful for modeling insect populations within an area for many species show zonal anisotropy, i.e. the degree of species density varies with location (Liebhold et al., 1993). This spatial heterogeneity could be due to any number of factors from migration to mating. I chose to look for spatial heterogeneity in the hemlock woolly adelgid population within Estabrook Woods. This was primarily due the fact that the primary vectors for transport of the hemlock woolly adelgid are small mammals, birds, and the wind (Orwig et al., 2002). Birds help establish hemlock woolly adelgid populations within hemlock stands while small mammals and the wind help to increase local distribution (McClure, 1990). With this in mind, it is likely that hemlock woolly adelgid populations would show a “hotspot” distribution pattern, with the highest population densities closest to the area where the population was established. Using the inverse distance weighted regression tool in the geostatistical analyst extension I was able to interpolate values at unsampled locations within my survey area. This geostatistical estimation tool helps highlight “hotspots” that otherwise may not be apparent when looking at a set of spatially disparate data points such as the coordinates of the hemlocks. The prediction map that it generated definitively shows a hemlock woolly adelgid hotspot in the northwest portion of the survey area (Figure 2). FIGURE 2: PREDICTION MAP OF ADELGID DISTRIBUTION FIGURE 3: INFECTION DENSITY DEPENDENCE CONCLUSIONS Since hemlock woolly adelgid populations in New England suffer from high mortality due to extreme winter cold snaps, population success relies heavily upon reinfestation (Parker et al., 1999). The high density regions, or hot spots, of hemlock woolly adelgid within a forest likely ensure the success of these reinfestations by maintaining a high enough density for substantive vector spread following these massive die-offs. Therefore, by targeting these hot spots the chemical pest management strategy can be the most effective at combating the spread of the pest. A point density analysis was also conducted on the hemlock distributions within the survey area and was weighted for hemlock woolly adelgid density (Figure 3). The result shows, unsurprisingly, that close proximity of hemlocks to one another helps promote adelgid population growth likely through ease of vector transmission. Considering that there are uninfected hemlocks within close proximity to the hotspot it is highly likely that they will become infected in the near future. Further work will be conducted this summer on using natural chemical treatments to control the spread of the hemlock woolly adelgid to these uninfected trees. References 1. Orwig, D., Foster, D. & Mausel, D. (2002). Landscape patterns of hemlock decline in New England due to the introduced hemlock woolly adelgid. Journal of Biogeography, 29, 1475 – 1487. 2. Parker, B.L., Skinner, M., Gouli, S., Ahikaga, T. & Teillon, H.B. (1998) Survival of hemlock woolly adelgid (HomopteraAdelgidae) at low temperatures. Forest Science, 44, 414–420 3. McClure, M.S. (1990) Role of wind, birds, deer, and humans in the dispersal of hemlock woolly adelgid (HomopteraAdelgidae). Environmental Entomology, 19, 36–43. 4. McClure, M.S. (1991) Density-dependent feedback and population cycles in Adelgestsugae (HomopteraAdelgidae) on Tsugacanadensis. Environmental Entomolology, 20, 258–264. 5. Liebhold, A., Rossi, R. & Kemp, K. (1993). Geostatistics and Geographic Information Systems in Applied Insect Ecology. Annual Review of Entomology, 38, 303-327. 6. Costa, S. & Onken, B. (2006). Standardizing Sampling for Detection and Monitoring of Hemlock Woolly Adelgid in Eastern Hemlock Forests. Retrieved on February 7, 2011 from www.na.fs.fed.us/fhp/hwa/pubs/proceedings/2006/fhtet_2006.pdf 7. Peterson, S. (1997). Nature Preserved: Agreement protects natural character of Estabrook Woods. Retrieved from the Harvard University Gazette Online on April 28, 2011 at http://news.harvard.edu/gazette/1997/01.16/NaturePreserved.html 8. Stites, P. (2006). Kennedy, Kerry, and Meehan Weigh In: Middlesex School Should Preserve Estabrook Woods. Retrieved on February 7, 2011 from http://estabrookwoods.org/pdf/july16release.pdf All maps were drawn in ArcMap 10 and background imagery was supplied by ESRI. Photos were obtained through Google images and links can be provided upon request. Thank you.