Download
1 / 83
830 likes | 934 Vues
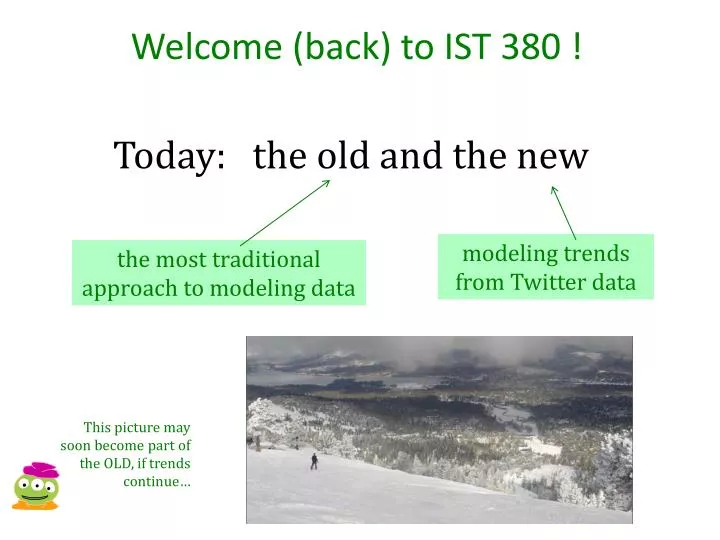
Welcome (back) to IST 380 !. Today: the old and the new. modeling trends from Twitter data. the most traditional approach to modeling data. This picture may soon become part of the OLD, if trends continue…. Assignments…. Homework #1 is complete! (2/5).

E N D
Welcome (back) to IST 380 ! Today: the old and the new modeling trends from Twitter data the most traditional approach to modeling data This picture may soon become part of the OLD, if trends continue…
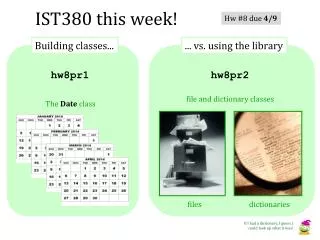
Assignments… Homework #1 is complete! (2/5) Getting started with R (tutorial + "quiz" + text) Make sure you can submit to our submission site! Zac & Suleng Homework #2 is due tomorrow (2/12) Pr #1: text, Chapters 6-9 Pr #2: Monty Hall challenge Pr #3: writing a predictive model by hand… Homework #3 is due next Tuesday (2/20) Pr #1: text, Chapter 10 Pr #2: the envelope, please! Things are heating up here! Pr #3: linear models for prediction
The age of data? I prefer my data well-aged!
R path! 1 2 3 … R's toolset and its capabilities… Programming Skills data collection descriptive vs. generative vs. predictive statistics Subject Expertise predictions using linear regression I predict we'll get here, but not necessarily in a straight line!…
packages library lapply order diff Descriptive statistics: Twitter data Tweet "diffs" for a certain hashtag… Chapter 10 introduces access to Twitter data and statistical descriptions using these data
packages: bitops Rcurl RJSONIO twitteR later: UsingR Some R: library Once you have installed these packages You can ensure they're present with library(bitops) and so on… Chapter 10 will have you write a function to automate this process… What if I don't have hands?! Caution! Some of these may have to be installed by hand…
Some R: style… I have NO COMMENT about this function!
Some R: style… better, but not ideal
Some R: style… use variables to hold intermediate values!
Some R: lapply and vapply Clock in Bristol, UK Allow you to apply a function to every element of a list or a vector: > L <- list(8,9,10) > lapply( L, add1 ) [[1]] [1] 9 [[2]] [1] 10 [[3]] [1] 11 lapply(X, FUN, ...) > V <- 8:10 > vapply( V, add1, FUN.VALUE=42 ) [1] 9 10 11 vapply(X, FUN, FUN.VALUE ...)
UTC? Clock in Bristol, UK coordinated universal time since before the railroads… red minute hand: Bristol black minute hand: London (Greenwich)
UTC? can be plotted as-is take differences via as.numeric - so that "2013-02-11 20:55:03 UTC" becomes 1360616103
Some R: order and diff > V <- c(3,4,2,1) > V [1] 3 4 2 1 > order(V) [1] 4 3 1 2 > order(..., na.last = TRUE, decreasing = FALSE) order returns a permutation of its input… What do these numbers mean?
Some R: order and diff > V <- c(3,4,2,1) > V [1] 3 4 2 1 > order(V) [1] 4 3 1 2 > V[order(V)] [1] 1 2 3 4 order(..., na.last = TRUE, decreasing = FALSE) order returns a permutation of its input… What do these numbers mean? Why not just use sort? You can, but this let's you order anything in the same way! diff ?
Comparing tags? #losangeles #sanfransisco Which is which?
Comparing tags? #losangeles #sanfrancisco Which is which?
Comparing tags... Next week: we will quantify these differences more carefully… #losangeles #sanfrancisco Which is which?
Generative statistics rgeom runif rnorm … sample replicate distribution of samples of state populations Chapter 7 reviews repeated sampling and the resulting distribution of means
Generative statistics rgeom runif rnorm … sample replicate Monte Carlo method: run a process many times to gain insights into it… distribution of samples of state populations Chapter 7 reviews repeated sampling and the resulting distribution of means
Hw3 pr2: A second Monte Carlo example : Both envelopes hold some positive amount of money (in a check or IOU), but one of these two envelopes holds twice as much money as the other. Should you switch or stay?
Hw3 pr2: A second Monte Carlo example : Switch! Both envelopes hold some positive amount of money (in a check or IOU), but one of these two envelopes holds twice as much money as the other. Should you switch or stay? but, then, should you switch back?
Hw3 pr2: A second Monte Carlo example : This week ~ write a function to model this process… Both envelopes hold some positive amount of money (in a check or IOU), but one of these two envelopes holds twice as much money as the other. Should you switch or stay?
Hw3 pr2 Write a Mystery Envelope function: ME_once <- function( amount_found=1.0, sors="switch", verbose=TRUE) … that runs one envelope trial … and returns the amount of $ "earned" Another to run it N times: ME_ntimes <- function( n=100 ) And another to run it N times: sample_ME <- function( run_me=100 )
Assignments… Homework #1 is complete! (2/5) Getting started with R (tutorial + "quiz" + text) Make sure you can submit to our submission site! Homework #2 is due tomorrow (2/12) Pr #1: text, Chapters 6-9 Pr #2: Monty Hall challenge Pr #3: writing a predictive model by hand… Homework #3 is due next Tuesday (2/20) Pr #1: text, Chapter 10 Pr #2: the envelope, please! Things are heating up here! Pr #3: linear models for prediction
Big Ideas: Predictive modeling Linear regression The human role… !
So, what is Machine Learning? The goal of machine learning also known as predictive statistics/analytics, is to find a function that yields outputs for previously-unseen inputs… prediction: did the passenger survive? passenger details function
So, what is Machine Learning? The goal of machine learning also known as predictive statistics/analytics, is to find a function that yields outputs for previously-unseen inputs… prediction: did the passenger survive? passenger details For Hw2, you are building this function by hand. function
R is for Regression! The oldest and (still) most popular technique for automatically generating a model from data. problem 3 this week…
Regression What is it?
Regression ~ predictive modeling this week: making an assumption of linear dependence on the inputs
But why is it called regression? 1877: "reversion" (peas) 1885: "regression" (people)
make this sum of squared errors (residuals) as small as possible