Download
1 / 40
400 likes | 494 Vues
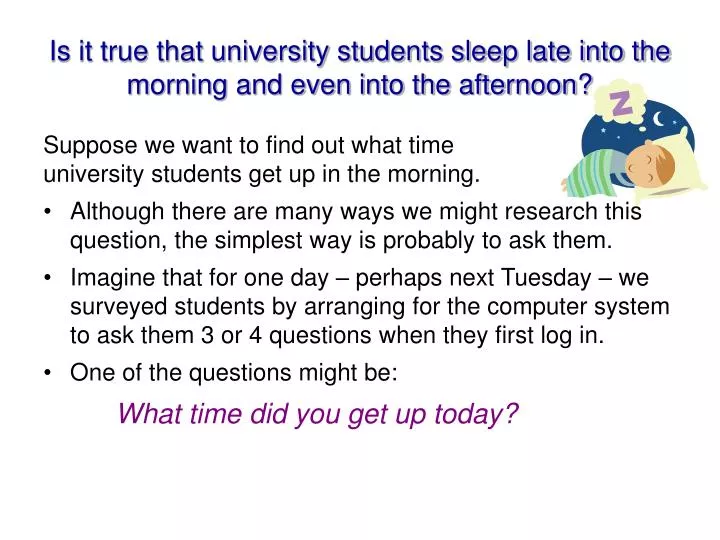
Is it true that university students sleep late into the morning and even into the afternoon?. Suppose we want to find out what time university students get up in the morning. Although there are many ways we might research this question, the simplest way is probably to ask them.

E N D
Is it true that university students sleep late into the morning and even into the afternoon? Suppose we want to find out what time university students get up in the morning. • Although there are many ways we might research this question, the simplest way is probably to ask them. • Imagine that for one day – perhaps next Tuesday – we surveyed students by arranging for the computer system to ask them 3 or 4 questions when they first log in. • One of the questions might be: What time did you get up today?
Answers to our survey question:What time did you get up today? Here are some data that we might have collected: 10:30 8:00 11:30 10:30 10:00 11:30 11:00 12:00 10:30 12:00 11:00 9:30 11:00 11:00 10:30 12:30 11:30 11:00 13:00 10:00 How can we use these data to answer our research question? Is it true that university students sleep late into the morning and even into the afternoon?
How can we use these data (from our survey question) to answer our research question? We should start by seeing how many students wake up at each of the times. To make this task easier, we can arrange our data in order by time, so that the ones that are the same appear together in the list 10:30 8:00 11:30 10:30 10:00 11:30 11:00 12:00 10:30 12:00 11:00 9:30 11:00 11:00 10:30 12:30 11:30 11:00 13:00 10:00 8:00 11:00 9:30 11:00 10:00 11:00 10:00 11:30 10:30 11:30 10:30 11:30 10:30 12:00 10:30 12:00 11:00 12:30 11:00 13:00
How can we use these data (from our survey question) to answer our research question? Count how many students woke up at each time: Before 8:30 ____ 8:30 ____ 9:00 ____ 9:30 ____ 10:00 ____ 10:30 ____ 11:00 ____ 11:30 ____ 12:00 ____ 12:30 ____ After 12:30 ____ 8:00 11:00 9:30 11:00 10:00 11:00 10:00 11:30 10:30 11:30 10:30 11:30 10:30 12:00 10:30 12:00 11:00 12:30 11:00 13:00 You don’t need to type in the numbers – just write them down on a scrap of paper.
How can we use these data (from our survey question) to answer our research question? Before 8:30 1 8:30 0 9:00 0 9:30 1 10:00 2 10:30 4 11:00 5 11:30 3 12:00 2 12:30 1 After 12:30 1 Count how many students woke up at each time: Before 8:30 ____ 8:30 ____ 9:00 ____ 9:30 ____ 10:00 ____ 10:30 ____ 11:00 ____ 11:30 ____ 12:00 ____ 12:30 ____ After 12:30 ____ 8:00 11:00 9:30 11:00 10:00 11:00 10:00 11:30 10:30 11:30 10:30 11:30 10:30 12:00 10:30 12:00 11:00 12:30 11:00 13:00 These counts (or frequencies)describe how the people were spaced out (or distributed) across the range of times. This set of numbers is called the frequency distribution.
How can we use these data (from our survey question) to answer our research question? Before 8:30 1 8:30 0 9:00 0 9:30 1 10:00 2 10:30 4 11:00 5 11:30 3 12:00 2 12:30 1 After 12:30 1 Before 8:30 ____ 8:30 ____ 9:00 ____ 9:30 ____ 10:00 ____ 10:30 ____ 11:00 ____ 11:30 ____ 12:00 ____ 12:30 ____ After 12:30 ____ It can sometimes be easier to ‘see’ the data if they are shown as a graph. A bar graph that has the categories along the x-axis (the bottom) and how often they occur (the frequencies) along the y-axis (the side) is called afrequency histogram.
Describing the data: The frequency histogram is a useful way to see what the data look like. But sometimes it’s necessary to describe the data with words (and numbers). For someone else to be able to see what the data look like, without going through all of the data or seeing the graph, what sort of information would they need? Type in your best answer below, and then we’ll examine the possibilities together.
Describing the data: • To describe the data, we need to communicate . . . • where the middle or bulk of the data are (if there is a place where the data are thickest) measures of central tendency • how spread out the data are measures of dispersion • whether the data are spread evenly on both sides of the middle, or not Are the data normal or skewed?
Describing where the centre of the data is:measures of central tendency Before 8:30 1 8:30 0 9:00 0 9:30 1 10:00 2 10:30 4 11:00 5 11:30 3 12:00 2 12:30 1 After 12:30 1 Before 8:30 ____ 8:30 ____ 9:00 ____ 9:30 ____ 10:00 ____ 10:30 ____ 11:00 ____ 11:30 ____ 12:00 ____ 12:30 ____ After 12:30 ____ 8:00 11:00 9:30 11:00 10:00 11:00 10:00 11:30 10:30 11:30 10:30 11:30 10:30 12:00 10:30 12:00 11:00 12:30 11:00 13:00 There are three main measures of central tendency – Mean (or average) Median (or mid-point) Mode(or most frequent point)
Describing where the centre of the data is: Before 8:30 1 8:30 0 9:00 0 9:30 1 10:00 2 10:30 4 11:00 5 11:30 3 12:00 2 12:30 1 After 12:30 1 Before 8:30 ____ 8:30 ____ 9:00 ____ 9:30 ____ 10:00 ____ 10:30 ____ 11:00 ____ 11:30 ____ 12:00 ____ 12:30 ____ After 12:30 ____ 8:00 11:00 9:30 11:00 10:00 11:00 10:00 11:30 10:30 11:30 10:30 11:30 10:30 12:00 10:30 12:00 11:00 12:30 11:00 13:00 What time is the median value? Part 1: Type in your answer below. (If you don’t know or don’t remember what the median is, type ‘?’) Text input item
Describing where the centre of the data is: What time is the median value? Part 2: Select your answer from the list below. A: 10:00 B: 10:30 C: 11:00 D: 11:30 E: Don’t know Before 8:30 1 8:30 0 9:00 0 9:30 1 10:00 2 10:30 4 11:00 5 11:30 3 12:00 2 12:30 1 After 12:30 1 Before 8:30 ____ 8:30 ____ 9:00 ____ 9:30 ____ 10:00 ____ 10:30 ____ 11:00 ____ 11:30 ____ 12:00 ____ 12:30 ____ After 12:30 ____ 8:00 11:00 9:30 11:00 10:00 11:00 10:00 11:30 10:30 11:30 10:30 11:30 10:30 12:00 10:30 12:00 11:00 12:30 11:00 13:00 Multiple choice
Describing where the centre of the data is: What time is the median value? Part 2: Select your answer from the list below. A: 10:00 B: 10:30 C: 11:00 D: 11:30 E: Don’t know Before 8:30 1 8:30 0 9:00 0 9:30 1 10:00 2 10:30 4 11:00 5 11:30 3 12:00 2 12:30 1 After 12:30 1 Before 8:30 ____ 8:30 ____ 9:00 ____ 9:30 ____ 10:00 ____ 10:30 ____ 11:00 ____ 11:30 ____ 12:00 ____ 12:30 ____ After 12:30 ____ 8:00 11:00 9:30 11:00 10:00 11:00 10:00 11:30 10:30 11:30 10:30 11:30 10:30 12:00 10:30 12:00 11:00 12:30 11:00 13:00 Well done! The average of 11:00 and 11:00 is 11:00
Describing where the centre of the data is: Sorted dataset The median value is the value that is exactly in the middle of the list when the data have been sorted. When there is an odd number of cases,the median is the value of the case in the middle of the sorted list. When there is an even number of cases,the median is the average of the values for the pair in the middle of the sorted list. Before 8:30 1 8:30 0 9:00 0 9:30 1 10:00 2 10:30 4 11:00 5 11:30 3 12:00 2 12:30 1 After 12:30 1 Before 8:30 ____ 8:30 ____ 9:00 ____ 9:30 ____ 10:00 ____ 10:30 ____ 11:00 ____ 11:30 ____ 12:00 ____ 12:30 ____ After 12:30 ____ 111 212 313 414 515 616 717 818 919 1020 8:00 11:00 9:30 11:00 10:00 11:00 10:00 11:30 10:30 11:30 10:30 11:30 10:30 12:00 10:30 12:00 11:00 12:30 11:00 13:00 For 1st error on median
An brief exercise on the median score Imagine that the student union surveyed students about their monthly accommodation costs. For the sake of this exercise, we will just look at a small sample of their data – just 7 replies: £180, £200, £250, £165, £325, £195, £175 First, sort the data: Which is the lowest cost? Type in your answer below. Number entry
An brief exercise on the median score Imagine that the student union surveyed students about their monthly accommodation costs. For the sake of this exercise, we will just look at a small sample of their data – just 7 replies: £180, £200, £250, £165, £325, £195, £175 First, sort the data: Which is the lowest cost? Woops! The lowest value is £165!
An brief exercise on the median score Imagine that the student union surveyed students about their monthly accommodation costs. For the sake of this exercise, we will just look at a small sample of their data – just 7 replies: £180, £200, £250, £165, £325, £195, £175 First, sort the data: £165, ? Which is the next lowest cost? Type in your answer below. Number entry
An brief exercise on the median score Imagine that the student union surveyed students about their monthly accommodation costs. For the sake of this exercise, we will just look at a small sample of their data – just 7 replies: £180, £200, £250, £165, £325, £195, £175 First, sort the data: £165, ? Which is the next lowest cost? Woops! The next lowest value is £175!
An brief exercise on the median score Imagine that the student union surveyed students about their monthly accommodation costs. For the sake of this exercise, we will just look at a small sample of their data – just 7 replies: £180, £200, £250, £165, £325, £195, £175 First, sort the data: £165, £175, . . . Which is the next lowest cost? Type in your answer below. Number entry
An brief exercise on the median score Imagine that the student union surveyed students about their monthly accommodation costs. For the sake of this exercise, we will just look at a small sample of their data – just 7 replies: £180, £200, £250, £165, £325, £195, £175 First, sort the data: £165, £175, . . . Which is the next lowest cost? Woops! The next lowest value is £180!
An brief exercise on the median score Imagine that the student union surveyed students about their monthly accommodation costs. For the sake of this exercise, we will just look at a small sample of their data – just 7 replies: £180, £200, £280, £165, £325, £185, £175 First, sort the data: £165, £175, £180, . . . You have the idea . . . the sorted costs are: £165, £175, £180, £185, £200, £280, £325 The median is the value of the data point in the middle of the sorted list.
An brief exercise on the median score Imagine that the student union surveyed students about their monthly accommodation costs. The sorted costs are: £165, £175, £180, £185, £200, £280, £325 The median is the value of the data point in the middle of the sorted list. There are two easy ways to find the median for a short list:(1) Cancel data points from each end of the list until there is just one (or two) remaining: £165, £175, £180, £185, £200, £280, £325 £165, £175, £180, £185, £200, £280, £325 £165, £175, £180, £185, £200, £280, £325 Median If there had been two points left in the middle, the average of those two values would be the median.
An brief exercise on the median score Imagine that the student union surveyed students about their monthly accommodation costs. The sorted costs are: £165, £175, £180, £185, £200, £280, £325 The median is the value of the data point in the middle of the sorted list. There are two easy ways to find the median for a short list:(2) Count the number of scores and divide by 2. When there are an odd number of data points, the result will include a fraction (e.g. 3.5). Count up from the beginning of the sorted list for the whole number part (e.g. 3) of the result, and select the value of the next data point in the list. That value is the median. When there are an even number of data points, the result will not include a fraction (e.g., 3). Count up from the beginning of the sorted list for that result. Select the number you finish with and the next number in the list; average those two numbers. That average is the median. 7 2 = 3.5; Count up 3 (£165, £175, £180), Select the next data point is £185 which is the median.
An brief exercise on the median score Imagine that the student union surveyed students about their hourly earnings. For the sake of this exercise, we will just look at a small sample of their data – just 10 replies: £5.10, £6.00, £5.50, £6.00, £15.00, £20.00, £6.50, £8.00, £6.80, £6.10 First, sort the data. Write down a sorted list.
An brief exercise on the median score Imagine that the student union surveyed students about their hourly earnings. For the sake of this exercise, we will just look at a small sample of their data – just 10 replies: £5.10, £6.00, £5.50, £6.00, £15.00, £20.00, £6.50, £8.00, £6.80, £6.10 Check your sorted list against the following. £5.10, £5.50, £6.00, £6.00, £6.10, £6.50, £6.80, £8.00, £15.00, £20.00 Now, identify the median value and type it below. Number entry
An brief exercise on the median score Imagine that the student union surveyed students about their hourly earnings. For the sake of this exercise, we will just look at a small sample of their data – just 10 replies: £5.10, £6.00, £5.50, £6.00, £15.00, £20.00, £6.50, £8.00, £6.80, £6.10 Check your sorted list against the following. £5.10, £5.50, £6.00, £6.00, £6.10, £6.50, £6.80, £8.00, £15.00, £20.00 Hmmm. . . That wasn’t the correct value. If you want to try again, you can. If you’re just not clear on the concept, just type ? Number entry
An brief exercise on the median score Imagine that the student union surveyed students about their hourly earnings. Okay, to make it a bit simpler, let’s just look at 3 replies; these are already sorted: £5.10, £5.50, £6.00 The median value is the one in the middle of the set of data. Which value is the median? Number entry
An brief exercise on the median score Imagine that the student union surveyed students about their hourly earnings. Okay, to make it a bit simpler, let’s just look at 3 replies; these are already sorted: £5.10, £5.50, £6.00 The median value is the one in the middle of the set of data. The value you typed was not the median value. The median value – the middle value – is £5.50. It’s the one in the middle.
An brief exercise on the median score Imagine that the student union surveyed students about their hourly earnings. Okay, to make it a bit simpler, let’s just look at 3 replies; these are already sorted: £5.10, £5.50, £6.00 The median value is the one in the middle of the set of data. Right! The median value – the middle value – is £5.50 for this set of data. Number entry
An brief exercise on the median score Imagine that the student union surveyed students about their hourly earnings. Now let’s consider a set of 4 replies; these are already sorted: £5.10, £5.50, £6.00, £6.00 The median value is the one in the middle of the set of data. When the middle of the set is a pair of data points – when the data set has an even number of data points – the median is the average of the two data points in the middle. Which value is the median for this set of 4 data points? Number entry
An brief exercise on the median score Imagine that the student union surveyed students about their hourly earnings. Now let’s consider a set of 4 replies; these are already sorted: £5.10, £5.50, £6.00, £6.00 The median value is the one in the middle of the set of data. When the middle of the set is a pair of data points – when the data set has an even number of data points – the median is the average of the two data points in the middle. The value you typed was not the median value. The median value is the average of the two values in the middle: £5.50 and £6.00, which is £5.75.
An brief exercise on the median score Imagine that the student union surveyed students about their hourly earnings. Consider another set of 4 replies; these are already sorted: £6.10, £6.40, £6.60, £8.00 The median value is the one in the middle of the set of data. When the middle of the set is a pair of data points – when the data set has an even number of data points – the median is the average of the two data points in the middle. Which value is the median for this set of 4 data points? Number entry
An brief exercise on the median score Imagine that the student union surveyed students about their hourly earnings. Consider another set of 4 replies; these are already sorted: £6.10, £6.40, £6.60, £8.00 The median value is the one in the middle of the set of data. When the middle of the set is a pair of data points – when the data set has an even number of data points – the median is the average of the two data points in the middle. The value you typed was not the median value. The median value is the average of the two values in the middle: £6.40 and £6.60, which is £6.50.
An brief exercise on the median score Please contact your tutor and/or read about the median value in your textbook. There seems to be some confusion here, and it looks like you really ought to talk to a tutor to get it sorted out.
An brief exercise on the median score Imagine that the student union surveyed students about their hourly earnings. Consider another set of 4 replies; these are already sorted: £6.10, £6.40, £6.60, £8.00 The median value is the one in the middle of the set of data. When the middle of the set is a pair of data points – when the data set has an even number of data points – the median is the average of the two data points in the middle. It looks like you’ve got it! Well done! The median value is the average of the two values in the middle: £6.40 and £6.60, which is £6.50.
An brief exercise on the median score Imagine that the student union surveyed students about their hourly earnings. Now let’s consider a set of 4 replies; these are already sorted: £5.10, £5.50, £6.00, £6.00 The median value is the one in the middle of the set of data. When the middle of the set is a pair of data points – when the data set has an even number of data points – the median is the average of the two data points in the middle. Well done! The median value is the average of the two values in the middle: £5.50 and £6.00, which is £5.75.
An brief exercise on the median score Imagine that the student union surveyed students about their hourly earnings. For the sake of this exercise, we will just look at a small sample of their data – just 10 replies: £5.10, £6.00, £5.50, £6.00, £15.00, £20.00, £6.50, £8.00, £6.80, £6.10 Check your sorted list against the following. £5.10, £5.50, £6.00, £6.00, £6.10, £6.50, £6.80, £8.00, £15.00, £20.00 Now, identify the median value and type it below. The points in the middle were £6.10 and £6.50. (£6.10 + £6.50) 2 = £12.60 2 = £6.30 Well done!
Describing where the centre of the data is: Before 8:30 1 8:30 0 9:00 0 9:30 1 10:00 2 10:30 4 11:00 5 11:30 3 12:00 2 12:30 1 After 12:30 1 Count how many students woke up at each time: Before 8:30 ____ 8:30 ____ 9:00 ____ 9:30 ____ 10:00 ____ 10:30 ____ 11:00 ____ 11:30 ____ 12:00 ____ 12:30 ____ After 12:30 ____ 8:00 11:00 9:30 11:00 10:00 11:00 10:00 11:30 10:30 11:30 10:30 11:30 10:30 12:00 10:30 12:00 11:00 12:30 11:00 13:00 What time is the modal value? (If you don’t know or don’t remember what the mode is, type ‘?’)
Describing where the centre of the data is: Before 8:30 1 8:30 0 9:00 0 9:30 1 10:00 2 10:30 4 11:00 5 11:30 3 12:00 2 12:30 1 After 12:30 1 Count how many students woke up at each time: Before 8:30 ____ 8:30 ____ 9:00 ____ 9:30 ____ 10:00 ____ 10:30 ____ 11:00 ____ 11:30 ____ 12:00 ____ 12:30 ____ After 12:30 ____ 8:00 11:00 9:30 11:00 10:00 11:00 10:00 11:30 10:30 11:30 10:30 11:30 10:30 12:00 10:30 12:00 11:00 12:30 11:00 13:00 What time is the mean value? (If you don’t know or don’t remember what the mean is, type ‘?’)
Describing how the data are spread out: Before 8:30 1 8:30 0 9:00 0 9:30 1 10:00 2 10:30 4 11:00 5 11:30 3 12:00 2 12:30 1 After 12:30 1 Count how many students woke up at each time: Before 8:30 ____ 8:30 ____ 9:00 ____ 9:30 ____ 10:00 ____ 10:30 ____ 11:00 ____ 11:30 ____ 12:00 ____ 12:30 ____ After 12:30 ____ 8:00 11:00 9:30 11:00 10:00 11:00 10:00 11:30 10:30 11:30 10:30 11:30 10:30 12:00 10:30 12:00 11:00 12:30 11:00 13:00 xx