Download
1 / 29
290 likes | 531 Vues
Earthquake Probabilities for the San Francisco Bay Region 2002-2031. Working Group 2002: Chapter 6 Ved Lekic EQW, April 6, 2007. Background. Probabilities are weighted averages of Poisson, Brownian Passage Time, Time-predictable and Empirical probability models

E N D
Earthquake Probabilities for the San Francisco Bay Region 2002-2031 Working Group 2002: Chapter 6 Ved Lekic EQW, April 6, 2007
Background • Probabilities are weighted averages of Poisson, Brownian Passage Time, Time-predictable and Empirical probability models • Mean probability and 95% confidence bounds • Time period: 2002-2031 • Regional and Individual Fault earthquake probabilities
Regional Earthquake Probabilities • 30 year probabilities of large earthquakes
Regional Earthquake Probabilities • Smaller quakes can be costly. 1987 M5.9 Whittier Narrows caused $350M in damage • Historical record places bounds on probabilities of 6.0≤M<6.7 : • 1972-2001 lower bound 0.8 or Nexp = 1.6 • 1850-1906 upper bound 0.99 or Nexp = 4.6 • SFBR model extended using Gutenberg-Richter with b = 0.9 predicts: • 0.96 [0.91 - 0.99] or Nexp = 3.3
Regional Earthquake Probabilities • Exposure times other than 30 years • Similarities with Poisson Model prediction “reflect the distributed weights assigned to the “competing” models - which in turn stems from uncertainty about the effects of the” 1906 stress shadow.
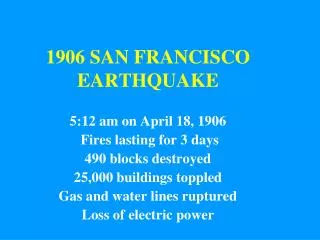
San Andreas Fault • Master fault carrying half of plate motion across the region • 1906 had largest surface rupture of any continental strike slip earthquake • High likelihood of floating earthquake (M6.9) • Nearly uniform probabilities of rupture of each segment • Loma Prieta stress change cause of SAP > SAS probabilities
Hayward-Rodgers Creek (140 km) • Essentially two different and independent faults • HS and HN experiencs significant aseismic creep • Most likely to produce M≥6.7 quake • Uncertainties from: • Depth extent of aseismic creep • Existence and position of HS-HN segmentation point
Calaveras Fault (123 km) • Southern two segments > 1/3 of plate motion across the SFBR and creep aseismically • Surface breaking quake on CN between 1160 and 1425 a.c.e. • Largest historical earthquakes in 1911 and 1984 (both M6.2) • Segments thought to rarely link up • Uncertainties: • Can creeping segments produce M≥6.7 since they also have high rates of moderate sized quakes?
Concord-Green Valley (56 km) • No large quakes in historical period • M5.4 on central Concord Fault in 1955 • Aseismic slip present but significance unknown source of uncertainty! • Only M6.0 to M6.7 are likely
San Gregorio (175 km) • Unlikely any activity in historical era (small probability of 1838) • SGS under water; SGN large slip events • Multiple traces under Montery Bay • Golden Gate segmentation point uncertain • Possibility of linking SGN with SAN neglected • Uncertain slip rate, past seismicity, effect of 1906
Greenville Fault (23-63 km) • Central part had M5.8 and M5.4 quakes in 1980 • Paleoseismic events of unknown magnitude occurred • Unknown whether norther and southern segments rupture together or separately
Mt Diablo Thrust (20-30 km) • Blind thrust fault resulting from crustal shortening within a fold-and-thrust belt • Treated as a single earthquake source
Background Earthquakes • Faults: slip rates < 1 mm/yr; undiscovered; poorly characterized • Significant seismicity in SFBR occurs on uncharacterized faults (Wesson 2002) • Third-most-important source region
Earlier Studies • WG88 & WG90 used magnitude threshold of M≥7 • WG88: SAF and Hayward; 0.5 30-year probability for each; time-predictable probability model • WG90: SAF, Hayward and Rodgers Creek; 0.67 30-year probability
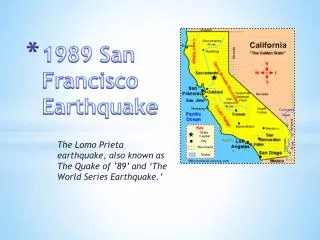
Improvements in WG02 • Inclusion of overall moment budget (36-43 mm/yr) • Inclusion of aseismic creep and 1989 shadow lower probabilities on SAF and Hayward • Inclusion of background seismicity, fault segmentation, multi-segment ruptures, and other faults • Multiple probability models (especially BPT) • Different treatments of 1906 stress-shadow
Sensitivity of Results: 1906 shadow • Uncertainty about 1906 stress change contributes to half of total uncertainty • 2 approaches to incorporating 1906: • BPT - underestimates stress shadow; upper bound • Empirical - faults in stress shadow; lower bound • 2 approaches neglecting 1906: • BPT without fault interactions & Poisson model • Time-predictable model for SAF used information on slip in 1906
Choice of Rupture Model • SAF and SG depend strongly on choice rupture model, while HRC and C do not
M-logA Relations • Determining M from A is a significant but not dominant source of uncertainty
Aseismic Slip • Used seismogenic scaling factor R: • Used to scale the area • Used to scale the slip rate
Aperiodicity • Used in BPT • Early in cycle, greater aperiodicity increases probabilities; late in cycle it decreases them