Download
1 / 14
140 likes | 248 Vues
Signatures of spatially extended reconnection in solar flares. Lyndsay Fletcher University of Glasgow. Spatially extended reconnection?. ‘Spatially extended’ could mean Extended along current sheet length (i.e. long, drawn out CS, like Sweet-Parker)

E N D
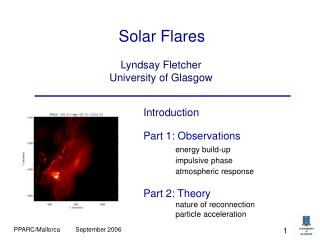
Signatures of spatially extended reconnection in solar flares Lyndsay Fletcher University of Glasgow
Spatially extended reconnection? • ‘Spatially extended’ could mean • Extended along current sheet length (i.e. long, drawn out CS, like Sweet-Parker) • Extended into 3rd dimension (e.g. an X-line) • Both – i.e. the ‘monolithic current sheet’ Linker et al (2003)
Vertically-extended current sheets? Fe XVII emission -> hot, turbulent, narrow, bright structure. Extended post-CME current sheet? Departed CME, plus several plasmoids Ciaravella & Raymond 2008 Closer to the Sun - HXR evidence for extended flare current sheet, but with multiple plasmoids – tearing instability? Sui et al (2005) with field lines sketched on.
Flare Ribbons Evidence for (2), (3)? Spatially extended ribbons in UV and Hα, and the arcade of loops joining them demonstrate coronal reconnection ‘orchestrated’ over scales of 105km. Bastille Day 2000 flare Red = UV emission (C IV) Blue = EUV Fe IX/X Green = EUV Fe XI/XII Image made in flare late phase. 1.8 ×10⁵ km Particularly the flare late phase shows this ordered behaviour. Early impulsive phase ribbons tend to look more irregular.
Flare hard X-ray footpoints Energetically, UV and Hα ribbons are unimportant. The main sites of impulsive energy release are indicated by hard X-ray and ‘white light’. HXR/WL sources are few in number and compact (i.e. not ribbon-like). The point-like appearance of HXR sources could be due to HXR image dynamic range. Occasionally, impulsive ribbon-like HXR or white-light emission is seen (2 examples known). Extended HXR ribbons Compact HXR footpoints Liu et al. 2007 Krucker et al. 2007
HXR source motions HXR and WL sources move systematically - this can be explained by one or two ‘primary’ sites of reconnection, which may be moving. e.g. antiparallel source motions – reconnection in sheared arcade. (Bogachev & Somov 2005) e.g. coloured crosses mark HXR footpoints progressing along the neutral line (Grigis & Benz 2004) (Need to understand how field anchored in HXR sources maps into corona – difficult. See e.g. DesJardins et al 2009)
Sub-structure of UV flare ribbons UV/EUV and Ha ribbons may look continuous, but they are not. Individual sources can be isolated, by separating out their lightcurves. Nishizuka et al 2009 – ribbon sub-structure has a distribution of size scales, down to ~ 2” and probably below.
Sub-structure of UV flare ribbons The overall ordered ribbon motion is composed of individual motions of UV sources within ribbon characterised by drift (spreading) plus diffusion. UV ribbons composed of many individual sources Above: Each dot and track shows start position and motion of a discrete UV footpoint (Fletcher et al. 04) Left: all tracks plotted with start points at (0,0)
Ribbon structuring => fragmented reconnection? UV drift speeds (~50 km/s) consistent with overall ribbon spreading. UV diffusion scales consistent with individual footpoints meandering along granular boundaries or along penumbral filaments. Could there be smooth field and uniform reconnection in the corona, but tangled field mapping to chromosphere/photosphere and photospheric restrictions on footpoint trajectories? Right now, I don’t think we can tell…
Light curves and correlations Extract UV light curve for each tracked source Filter, cross-correlate, identify pairs
Supra-arcade downflows Supra-arcade downflows (‘tadpoles’) interpreted as retracting flux tubes. Very suggestive of a fragmentary coronal reconnection process. McKenzie & Savage (2009) After Klimchuk, McKenzie NB most SADs observed with Yokhoh/SXT occur during flare impulsive phase (Khan et al. 2007)
Birn et al. 3D MHD simulations Simulations of energy transport in reconnecting 3D magnetic field by Birn et al (2009). Low b force-free High b Thermal energy flux, enthalpy flux and MHD Poynting flux tracked through corona. High β and low β initial states used. Low β state (β ~ 0.01) is appropriate for pre-flare conditions. Pre-flare During eruption
Low b case Initially smooth and almost straight separator splits into multiple reconnection sites (maybe interchange or ballooning instability?) Greyscale: Thermal energy flux/enthalpy flux Orange: MHD Poynting flux Projection of energy flux onto x-y (photospheric) plane in low b case Vertical velocity component, initially low b case.
Conclusions Flare ribbons provide evidence for extended reconnection volumes BUT with sub-structure on scales of a few arcsec and probably less. HXR/WL footpoints on the other hand could involve a very small subset of all the reconnecting field. There is an overall magnetic ordering, but within this there is fragmentation. Basic spatial scale? Probably not reached yet in observations Does the fragmentation develop in an initially smooth structure, or is the underlying field already tangled/non-uniform before reconnection sets in?