Download
1 / 53
550 likes | 743 Vues
Internal Wall Insulation on Solid Wall Buildings Some challenges. Neil May. INTERNAL WALL INSULATION – WHY?. INTERNAL WALL INSULATION – WHY?. ?. INTERNAL WALL INSULATION – WHY?. Any one for EWI ?.

E N D
Internal Wall Insulation on Solid Wall BuildingsSome challenges Neil May
? INTERNAL WALL INSULATION – WHY?
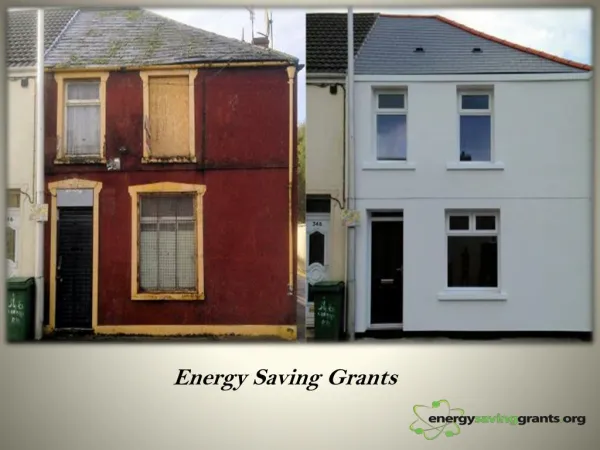
Any one for EWI? Assessing the execution of retrofitted external wall insulation for pre-1919 dwellings in Swansea (UK); Joanne Hopper et al2011
Assessing the execution of retrofitted external wall insulation for pre-1919 dwellings in Swansea (UK); Joanne Hopper et al 2011
Assessing the execution of retrofitted external wall insulation for pre-1919 dwellings in Swansea (UK); Joanne Hopper et al 2011
Background • Government/EU commitment to 80% reduction in GHG by 2050 • All buildings to be near to zero GHG/ Carbon emissions by 2050 • = One building every 50 seconds from now on • Green Deal/ ECO programme starting this autumn (?) with particular emphasis on solid wall buildings • 6 million plus solid wall buildings in UK, most in England, most are brick. • Minimum 2 million expected to use Internal Wall Insulation • Many cavity wall and other buildings to use IWI as well
Research Concerns • Thermal performance • Background issue of U values of traditional walls • Effect of IWI on thermal resistance of masonry • Thermal bridging issues • Overheating issues • Moisture performance • Effect of internal moisture • Effect of driven rain and other liquid moisture sources • Health • Effect of above on occupant health • Interaction with other factors especially ventilation
Thermal issues: Traditional walls • Do not conform to type of wall suited to BR 443 (using BS 9496) – ie discreet layers of known materials • Consequently in –situ testing of traditional wall U values show that most walls perform better than under BR443 (inclRdSAP (2009) default values. Typically traditional walls have U values of 0.9 to 1.6W/m2K for walls over 225mm wide. The thicker the wall the better the U value. • Performance is much affected by moisture. More moisture leads to lower thermal resistance. • U value calculations given for IWI on traditional walls need to take these issues into account.
External Insulation versus Internal Energy loss through external wall in % External insulation Thickness of internal insulation in cm
Practical limits: Thermal Bridges • Refurbishment of a traditional stone wall with 60 mm insulation on the inside • Reveal not insulated • Reveal now insulated with 40 mm insulation
Thermal Bridges: Party Wall Issues Before After 13,1 °C 13,1 °C 12,6 °C 15 °C • Partial fixed internal wall insulation: • Displacement of isotherms, surface temperature sinks on the non-insulated side of the wall • Risk of mould / mildew
Moisture – research background • Experimental work of Tim Padfield, Brian Ridout and others based on material qualities and site testing – no or little modelling used • German work of IBP based on laboratory testing and modelling • Masses of good conservation work and even more bad work on old buildings (no modelling or material testing, just observation) • Everyone agrees that Glaser (ie EN 13788 as per BS5250) is inappropriate for IWI unless walls are absolutely dry and protected. EN 15026 is correct standard at present
Modelling Protocols • BS EN 13788 (BS 5250) versus EN 15026
Driven rain and internal VCLs: Average water content of an external (German) wall Driven rain absorption 100% Variant 1: without VCL water content in kg/m2 Driven rain absorption 50% Variant 2: with VCL Driven rain absorption 0% Insulation thickness (k-value 0.040) in mm Source: Dr. A. Worch: Innendämmung: BauphysikalischeAspekte, Probleme und Grenzen und Lösungswegefür die Praxis (engl: Dr. A. Worch: Internal insulation: structural-physical aspects, problems and limits and solutions for the practice)
Conflicting understanding of risk? • Driven rain is not so important in Germany as UK • IBP sees presence of oxygen as critical • RH limits in IBP • Max RH with air = 85% • Max RH without air = 95% • Part F limits • 1 day 85% • 1 week 75% • 1 month 65%
Some Knowledge Gaps • Material data (thermal and moisture) for traditional buildings • Modelling (thermal and moisture) of traditional buildings • Thermal performance of traditional buildings • Moisture performance of all buildings esp traditional • Weather data – particularly wind driven rain • Mould formation processes and limits • Construction fault modelling? New DIN (68800-2) says 250g/m2 into structure; UK? • Durability of different materials under moisture (ie gypsum plaster) • Consequential effects on whole building performance and occupant health
KTP approach Aim is to find a safe, effective, saleable solution for mainstream application. So focus on 9” to 13” brick buildings in England. Three legged strategy: • Modelling • Case studies, real life monitoring • Laboratory testing Comparative testing of breathable and non-breathable systems
Modelling • Use of WUFI Pro 5 1D • Also use of Build Desk Modelling can tell you a lot, however…..
Problems with Modelling • Human error • Manipulation • Data errors/ unknowns (ie OSB µ = 30/175) • Simplification of complex structures • Problems at junctions/ bits you can’t model • Issue of how to model bad application • False certainty
Swansea, SW London, SW Pavadentro on 9” solid brick, 1%DR
Swansea, SW Swansea, N Pavadentro on 9” solid brick, 1%DR
London, N London, SW Pavadentro on 9” solid brick, 1%DR
Impact of density On 9”solid brick Swansea 1% DR
Case Studies • Very few available • 2 year KTP, but problems may take 10 or 20 years to develop • So many variables between each case study Neil May, February 2012
Case Studies • Solid brick and Pavadentro • 1 with external render • 1 without render • Solid brick and Celotex, without render, but brick impregnated • LEAF funded project • 2 solid stone terraces with Pavadentro system & one new breathable system (not started) • Trinity College Cambridge (not directly linked to KTP) • ERDF Aim High 10 solid wall brick houses in Birmingham
Trinity College • WUFI modelling with 3 different companies in 4 iterations, giving very different results • Material Property Testing (GCU) • Site survey (blower door, in situ U-value, RH monitoring, core samples for density and initial MC) 2 times with very different results • Extensive monitoring planned after application Neil May, February 2012
Laboratory testing • Test methodology • Laboratory test update • Proposals for future tests • Investigate the dry-out potential • Liquid moisture ingress – wind driven rain
Test methodology • 8 different internal insulation systems • 4 conventional systems – the most common IWI systems in the UK market • 4 breathable systems from NBT – development of two new systems
MOISTURE TRANSFER Moisture convection: leaks Liquid transport: Wind driven rain Vapour diffusion Construction moisture summer winter
MOISTURE TRANSFER – TEST 1 Moisture convection: leaks Liquid transport: Wind driven rain Vapour diffusion Construction moisture
T [ºC] T [ºC] INTERNAL WALL INSULATION – LIMITS EXT INT EXT INT Low temperature at the wall-insulation interface Risk of interstitial condensation and mould growth
INTERNAL WALL INSULATION – LIMITS Low temperature at the wall-insulation interface Risk of interstitial condensation and mould growth
To what extent breathable materials can reduce the risk of interstitial condensation?
TEST METHODOLOGY • Monitoring interstitial condensation by measuring the RH at the wall-insulation interface • 6 RH capacitance sensors each section • Additional test: comparison between monitoring and hygrothermal modelling (WUFI Pro)
Settings: • Driving force: vapour pressure differential • External conditions: Manchester TRY file from CIBSE, diurnal temperature variation into account • Internal conditions: WarmFront data (UCL), 80th percentile bedroom RH • Rain is not simulated TEST 1 Δ VP ΔVP ΔVP
TEST 1 The wall is exposed to: • November, December – winter: vapour adsorption due to diffusion • May, June – spring: vapour desorption due to diffusion
TEST 1 – COMPARISON OF RELATIVE HUMIDITY Breathable materials: 22% average RH reduction Non-breathable materials: 8% average RH reduction Higher speed of desorption in breathable materials
TEST 1 Higher speed of desorption in breathable materials (measured at the wall-insulation interface) • Possible reasons: • Low vapour permeability (vapour movement on both sides) • The capillary suction moves the moisture away from the critical interface • Breathable materials can store moisture • (hygroscopicity) ΔVP ΔVP
Settings: • WUFI Pro 1D • Climate file from chamber • Only diffusion (rain is off) • Initial conditions from chamber (trends comparison) COMPARISON OF MONITORING AND MODELLING
RH - simulated RH - monitored COMPARISON OF MONITORING AND MODELLING Dry-fit Pavadentro Wetting well simulated – drying underestimated
RH - simulated COMPARISON OF MONITORING AND MODELLING RH - monitored Pavaclay and Pavaflex
RH - simulated RH - monitored COMPARISON OF MONITORING AND MODELLING PIR
WUFI calculations agree with the measured data during vapour adsorption (“winter”) • The simulation underestimates the dry-out potential of the materials • Possible reason: • Underestimation of liquid transport coefficient in clay blocks and insulation materials • Incorrect algorithms in model COMPARISON OF MONITORING AND MODELLING Do we know the properties of materials in traditional buildings?
Some Specific Problems in Practice • Rising damp. • Different moisture levels at different parts of walls (ie corners). • Joist ends • Window reveals • Partition/ party walls • Uneven walls • Gypsum plaster • Knowing what walls are made of • Quality of workmanship/ bad application • Services • Application in wet areas (bathroom, below DPC,…) • What are extreme conditions/ limits? Human behaviour issues • Long term maintenance of fabric and building services
Some interactions to be considered • Internal Wall Insulation and thermal performance due to changing moisture levels • Overheating • Indoor air quality • Ventilation requirements and systems • Heating systems • Occupant behaviour