Download
1 / 44
440 likes | 526 Vues
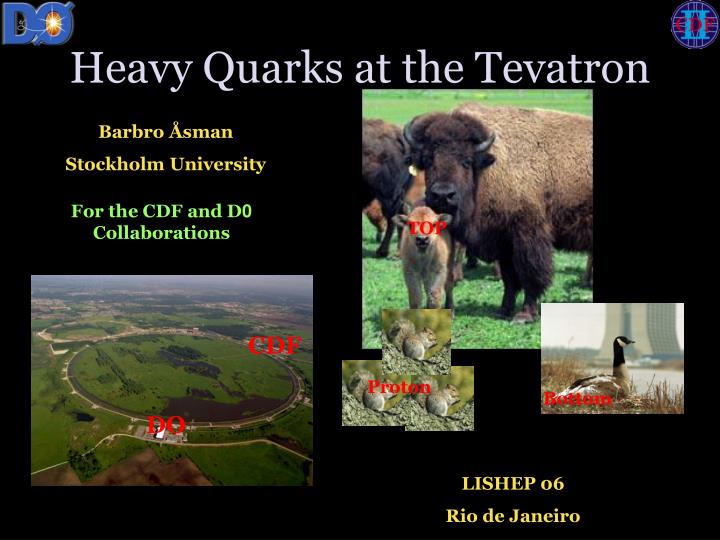
Heavy Quarks at the Tevatron. Barbro Åsman Stockholm University. For the CDF and D 0 Collaborations. TOP. CDF. Proton. Bottom. DO. Proton. LISHEP 06 Rio de Janeiro. Golden Eggs. Lifetimes: DG , L b , B s , B c. SURPRISES!?. B and D Branching ratios. Production properties:

E N D
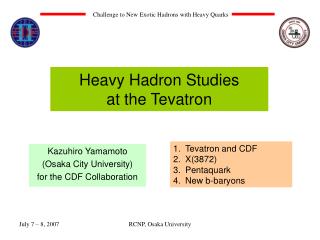
Heavy Quarks at the Tevatron Barbro Åsman Stockholm University For the CDF and D0 Collaborations TOP CDF Proton Bottom DO Proton LISHEP 06 Rio de Janeiro
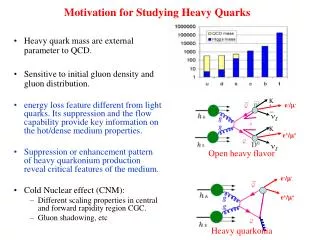
Golden Eggs Lifetimes: DG, Lb, Bs, Bc .. SURPRISES!? B and D Branching ratios Production properties: s(b), s(J/y), … CP Violation Mass measurements: Bc, Lb, Bs, … New particles: X(3872), Xb, Pentaquarks, … Mixing: Bs, Bd Rare decay searches: Bs -> µ+µ-, D0 -> µ+µ- , …
MB ct = Lxy PT Measuring Lb(udb) Lifetime WHY ?A ~2s Differance between theory and experiment for t(Lb)/t(B0).Theory = 0.86± 0.05 • HOW ? p Lxy PV p Lb L B0 K0 p xy-plane p p m m
LbLifetime • Extract lifetime with unbinned likelihood fit to • proper decay length and mass event information. New t(Lb)=1.45 + 0.14– 0.13± 0.02 (sys) ps t(Lb)=1.22 + 0.22– 0.18± 0.04 (sys) ps t(Lb)/t(B0) = 0.944 ± 0.089 t(Lb)/t(B0) = 0.87 +0.17-0.14 ± 0.03
Bc Contains Two Heavy Quarks • Unique system with two heavy quarks of different flavor • Probes heavy-quark theories in the region between the cc and bb • Decays in 3 different ways: b or c decays or bc annihilation • Low production rate B+,B0: 40%, • Bs,B baryons: 10%, Bc~ .05% Reconstruct Bc J/yen
Results m m Bc Lxy n e XY - plane MB ct = Lxy *K New PT (vis) t(Bc) = 0.474 + 0.073– 0.066 ± 0.033 (sys) ps Where K = PT(vis) / PT(B) is given from MC t(Bc)= 0.448 +0.123– 0.096± 0.121 (sys) ps
BL = B0 + B0 BH = B0 - B0 Review of B0 System • In the B0 system: physical mass eigenstates = flavor eigenstates Ignoring CP violation Time evolution of the two states is governed by the time-dependent Schrödinger equation and in the limit DG <<D m Prob (B0 -> B0) = ½ e-G t(1+cosDmt) Prob (B0 -> B0) = ½ e-G t(1-cosDmt) • where: DG = G H- GL (lifetime difference) • G = (GH+ GL)/2 • Dm = mH- mL (mass difference) oscillation frequency(Dmd , Dms)
Extract DG from Bs K+K- lifetime • Measurement of Bs -> K+K- lifetime (=tL) in 360pb-1 • Mass fit andlifetime fit: •Extraction of DG (CP)/G(CP): •This measurement gives ctL = 458 ± 24 ± 6 µm •HFAG average gives weighted average: (tL2 +tH2) /(tL + tH) •Extract tH •Thus derive DG/G =-0.080 ± 0.23 (stat) ±0.03 (syst) New
BS lifetime and DG Gives rise to both CP-even and CP-odd final states Bs0 -> J/YF t = 1.53 ± 0.08 +0.01-0.04 ps New DG= 0.15 ± 0.10 +0.03-0.04 ps
Vtb Vtd(s) t d(s) b W W d(s) t Vtd(s) Vtb b VudVub* VtdVtb* VcdVcb* VcdVcb* Bd and Bs Mixing Vud Vus Vub Vcd Vcs Vcb Vtd Vts Vtb Vud Vub* + VcdVcb* + VtdVtb* = 0 V = Vtd = l Vts a - Dmd = (lots of QCD) x Vtd Dms = (lots of QCD) x Vts g b 1 Dms/Dmd = (much less QCD ) x Vts / Vtd
Analysis Strategy • Bs oscillations is more difficult than Bd oscillations because of the fast mixing frequency In order to measure D m: • Reconstruct the Bs signal • Know the flavor of the meson at its production time (Flavor tagging) and get eD2 (tagging power) • Calculate Proper length resolution S = signal events eD2 = tagging pow er S/B = signal/background st = proper time resolution
Reconstruction • Currently only using semileptonic decay of the Bs • Bs -> Ds m X (Ds -> f p ) (f -> K+ K-) μD±: 7,422±281 μDs: 5,601±102 μDs: 26,710±560 μD±: 1,519±96 μD±: 7,422±281
m n Bs Ds Flavor Tagging Jet Charge b-hadron P.V. Soft lepton Tagging Side Vertexing Side Soft Lepton Tagging (m or e ): Charge of the leptons together with the jet charge gives the flavor of b Jet Charge Tagging : Sign of the weighted average charge of opposite B jet gives the flavor of b Secondary Vertex Charge
- - no osc osc N ( t ) N ( t ) = A ( t ) - + no osc osc N ( t ) N ( t ) Cross Check of Tagging On a Bd sample B0 B+ eD2 = (2.48 0±.21 +0.08-0.06 ) % Tagger tuned using Bd mixing measurement Dmd = 0.506 ± 0.020 ± 0.014ps-1
m n Bs XY plane Lxy Ds Bs Lifetime MB Where K = PT(lD) / PT(B) is given from MC ct = Lxy *K PT (lD)
Amplitude Fit Method Fit to data – A free parameter Bd Prob (B0 -> B0) = ½ e-G t(1+AcosDmt) Prob (B0 -> B0) = ½ e-G t(1-AcosDmt) Fit for oscillations amplitude A for a given Dm Expect A = 1 for frequency = true Dms Expect A = 0 for frequency = true Dms If no signal observed : Exclude Dms value at 95% C.L. In region where A+1.65sA < 1 Sensitivity at 95% C.L. is at Dms value for which 1.65sA=1 Bs
Bs Mixing Limit Uppgrade to an event by event fit Dms > 14.8 ps-1 @ 95% CL
Log Likelihood Scan With the assumption A = 1 17 < Dms < 21 ps-1 @ 90% CL Most probable value of Dms = 19 ps-1
Branching Ratios Top Top Mass Top Charge Top Lifetime Resonance Production b l n Production Cross Section t W p p W t q b q Rare/non SM Decays W Helicity Top
TOP PAIR PRODUCTION q t t t ~85% ~15% q t Standard model pair production via the strong interaction Discovered in Run I = 6.77 ± 0.42 pb for mtop = 175 GeV
46% 20% 14.6% 1.2% 2.4% 1.2% 14.6% TOP DECAY ALL HADRON [ 6 jets (2 b jets) ] Large BR ~ 46% Larges background DILEPTON [ ee, mm, em,+ 2 b jets ] Small BR ~ 5% Smallest background LEPTON + JETS [ e, m + 4 jets (2 b jets) ] Large BR ~ 30% Moderate background
DILEPTON CROSS SECTION Signal Selection : 2 high PTLeptons 2 high PT Jets Large missing ET Veto invariant mass = Z Background : Physics (from MC) : Z /g *→tt , Dibosons Instrumental (from Data): Faked Missing ET and Faked Leptons
DILEPTONS Results (Topological cuts): ee, mm and em combined CDF 750 pb-1 preliminary s = 8.3 ± 1.5(stat) ± 1.0(syst) ± 0.5(lumi) pb D0 350 pb-1 preliminary s = 8.6. +2.3-2.0 (stat) +1.2-1.0(syst) pb Result (b-tag): lepton + Track/b-tagging Secondary Vertex Displaced Tracks D0 350 pb-1 preliminary Lxy s= 7.1+2.6-2.2 (stat)±1.3(syst) pb Primary Vertex d0 Combined with em (topological) Promt Tracks s= 8.6+1.9-1.7 (stat)±1.3(syst) pb
Lepton+Jets Cross Section • Signal Selection • 1 high PT Leptons • 4 high PT Jets (2 b-jets) • Missing ET • Backgrounds • Physics : W+Jets • Instrumental: QCD Multijet Topological /Kinematics Analyses Neural Network Likelihood Discriminant s = 6.0± 0.6 (stat) ±0.9 (syst) pb s = 6.7+1.4-1.3 (stat)+0.9-0.8 (syst) pb
Lepton+Jets Cross Section Secondary Vertex Tag s = 8.2± 0.9 (stat)+0.9-0.8 (syst) pb s = 8.2± 0.6 (stat) ±1.0 (syst) pb
q q' q d u t W W q' b b t b t Single Top Top production via the Weak Current s-channel t-channel SM : s = 0.88 pb ± 8% s = 1.98 pb ± 8% A lot of background : W + jets, ttbar etc
Selecting Single Top • S channel: • - W • - High PT lepton • - Missing ET • 2 b – jets • - At least 1 b-tagged jet n l W b • T channel: • - W • - High PT lepton • - Missing ET • 2 b – jets • - At least 1 b-tagged jet • - 1 extra jet t p p b q
Single Top Search Likelihood Discriminant Method Separate Single top from Backgrounds Dzero limits with 370 pb-1 95% C.L.: s < 5.0 pbt < 4.4 pb CDF limits with 695 pb-1 95% C.L.: s < 3.2. pbt < 3.1 pb
t W W b H W W Why Interesting? Top mass is fundamentel parameter Top mass can constrain the Higgs mass trough the loop diagrams: Top mass can probe new physics
jet jet jet jet jet jet jet jet b-tag jet jet b-tag jet b-tag jet Hard to Measure lepton e/μ • Complicated events – 12 ways to interpret 4 jets • Reconstruction of jet energy scale is distorted by: additional interactions electronic noise pileup from previous buch-crossing energy deposition outside jet cone different response for different particles 20% of b-jets have muon and neutrino • Background contamination •
Top Mass Methodology TEMPLATES One mass per event from kinematic fit. Create templates using event simulated with different Mtop values + background. Perform maximum likelihood fit to extract final mass. MATRIX ELEMENT Build likelihood directly from PDFs, matrix element(s), and transfer functions that connect quarks and jets. Integrate over unmeasured quantities Calibrate measured mass and error using simulation.
CDF Template Method • Four samples with different S/B and sensitivity to top: • 0 b-tag 4 jets > 21 GeV • 1 b-tag 3 jets > 15 GeV , 4th : 8 GeV < Et < 15 GeV • 1 b-tag 4 jets > 15 GeV • 2 b-tag 3 jets > 15 GeV , 4th > 8 >GeV • -Use assignments with lowest χ2 • toreconstruct top mass. • - top masses equal • reconstructed Wnear MW • Reconstructed W mass to calibrate JES
CDF Result 173.4+-2.5(stat+JES)+-1.3(syst).
D0 Matrix Element Method Maximal use of information in each event: Calculating event-by-eventprobability to be signal or background, based on the respective matrix elements: Pevt(x;mtop; JES) = ftop*Psgn(x;mtop; JES) + (1-ftop) * Pbkg(x;JES) • x: reconstructed lepton and jets kinematics • JES from MW constraint. • Signal and background probabilities: from differential cross-sections • All events are combined in a likelihood -ln L(mtop;JES)=-lnΠ Pevt(xi;mtop;JES) Mtop = 170.6 ± 4.4 (stat.) ± 1.7 (syst.) GeV/c2 JES = 1.03 ± 0.03
Top Mass in Dilepton Events • Pros: • Fewer combinations • Cons: • Unconstrained kinematics: 2 neutrinos in final state • Small branching fraction (5%) D0: 370 pb-1 CDF: 700 pb-1 177 ± 11 (stat.) ± 4 (syst.) GeV/c2 164.5 ± 4.5 (stat.) ± 3.1 (syst.) GeV/c2
Are the other Properties of the Top Quark as Expected?Top Charge W-t-b
-1/3 -1/3 b b +2/3 -4/3 t t +1 -1 0 0 W W n n +1 -1 l l Top Charge Exotic 4th Generation Standard Model Analys method Assiciate lepton + b-jet to a top quark Kinematic fit for the ttbar hypothesis Determine charge of the b-jet PT weighted sum of tracks in the b-jet
Top Charge II D0 RunII (365pb-1) - 17 candidate events with two tagged b-jets, lepton, missing ET, 4 jets or more. - two entries per event for top and anti-top. - discriminate b and b with jet charge algorithm - calibrate Monte Carlo with data using two jet heavy flavor sample with opposite jet tagged with m charge. - excluded the hypothesis of an exotic quark with charge = -4/3 e at 95% confidence level.
Top Decay Properties We said tWb, but really 100%? Indirect measurement using the CKM matrix: • implies |Vtb| is 0.998 @ 90% CL With top quark samples we can measure it directly as “R”: The relative rates of ttbar events with 0/1/2 b-tags is very sensitive to R R = 1.03+0.19-0.17 (stat + syst) R > 0.64 @ 95% CL Vtb > 0.80 @ 95% CL R = 1.12+0.27-0.23 (stat + syst) R > 0.61 @ 95% CL Vtb > 0.78 @ 95% CL
Conclusion • Lots of Exciting Results are pouring out from CDF and DO! What I have shown is just the Top of the iceberg And there are much more in the pipeline Look forward to many more exciting results soon!