Download
1 / 21
250 likes | 417 Vues
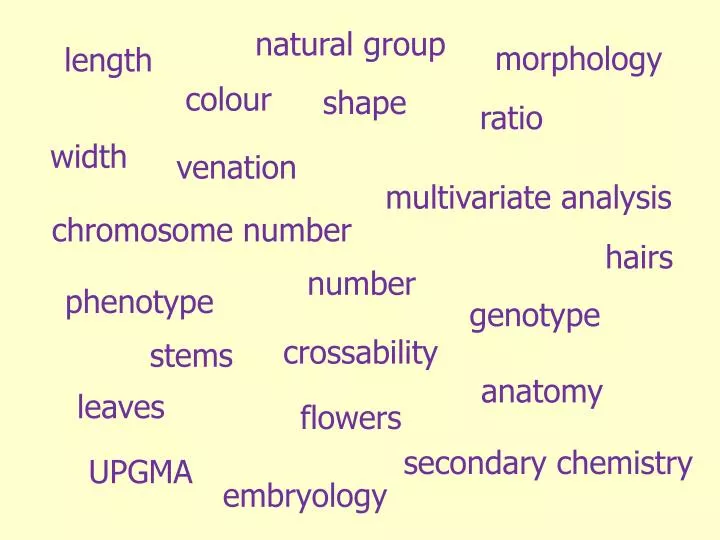
natural group. morphology. length. colour. shape. ratio. width. venation. multivariate analysis. chromosome number. hairs. number. phenotype. genotype. crossability. stems. anatomy. leaves. flowers. secondary chemistry. UPGMA. embryology. parsimony. RAPDs. chloroplast. PCR.

E N D
natural group morphology length colour shape ratio width venation multivariate analysis chromosome number hairs number phenotype genotype crossability stems anatomy leaves flowers secondary chemistry UPGMA embryology
parsimony RAPDs chloroplast PCR F-statistics bootstrap SNPs RFLPs monophyletic intron SSRs nucleus spacer Bayesian inference gene mitochondrion AFLPs paraphyletic maximum likelihood microsatellites
Types of DNA Plants have THREE genomes: • Nucleus • Chloroplast • Mitochondrion T A C G C G T A
Nuclear DNA • Large size, ca 10x106 kb in flowering plants • Linear arrangement, as chromosomes • Inheritance biparental • Recombination
Chloroplast DNA atpE atpB • Small, 120-220 kb • Circular, usually with inverted repeat • No recombination • Inheritance usually maternal in angiosperms, paternal in gymnosperms • Constant gene order in all green plants. rbcL large single copy region matK psbA rpl2 16S 23S rpl2 16S 23S trnH small scr
Main sources of DNA evidence • Control centres • turn genes on & off • Genes • single-copy • multi-copy • code for proteins • Inter-genic spacers • non-coding sequences between genes • Introns • non-coding sequences within genes transposons & retroviruses
Gene structure upstream enhancer TATA box exon 1 exon 2 exon 3 spacer promoter 5’ UTR intron 1 intron 2 3’ UTR • Introns are non-coding regions within a gene. • Spacers are non-coding regions between genes. • Both potentially highly variable regions. • Useful at genus level and below, sometimes down to population level. • Exons are composed of start, amino acid & stopcodons. • Highly conserved regions. • Useful at higher taxonomic levels, e.g. genus & above.
Multi-copy genes: rDNA 5.8S 25S 18S 25S 18S IGS IGS ITS1 ITS2 • Tandem repeats: 100s to 1000s of copies. • Nuclear genome: biparental inheritance. • sometimes problem with concerted evolution. • Coding regions (nS) highly conserved • 18S gene of soyabean shares 75% nucleotide homology with yeast. • ITS & IGS regions highly variable.
Making inferences from the data • Gene trees vs species or organism trees • often only two genes (or regions) studied [out of ca 25,000 genes present] • Data from the different genomes may or may not be congruent • each genome tells its own story, which may not be that of the whole organism
Approaches Phylogeny reconstruction, systematics • Sequencing Genepool & population level phenomena • RFLPs • ‘Fingerprinting’ • RAPDs • AFLPs • Microsatellites • Allozymes (protein products of genes)
Phylogeneticsystematics • parsimony. Identifies tree with minimium number of mutations (character-state changes). • maximum likelihood. Identifies tree that has the highest probability of producing the observed data, given a particular model of evolution. • Bayesian inference. Like maximum likelihood but much more sophisticated. Hurts the brain! • ALL TREES CAN BE TESTED STATISTICALLY!!! • bootstrap • jacknife • decay index
st 0.447 st 0.468 st 0.555 st 0.390 st 0.287 st 0.289 Genepool & population phenomena
RFLPsRestriction Fragment Length Polymorphisms • Use restriction enzymes to cut DNA at recognition sites (usually 6b long). • Separate fragments on an agarose gel. • Stain fragments with ethidium bromide & view with UV.
Different patterns are the result of gains/losses of restriction sites or inversions. Co-dominant in nuclear DNA: good for detecting hybrids. Fragment patterns in hybrids nuclear DNA probe enzyme 1 enzyme 2 12 7 9 4 5 • enzyme 2 fragments • AA AB BB • 14 ------ • 9 ------ • 5 ------ • 4 --- --- --- • enzyme 1 fragments • AA AB BB • 19--- --- • 12 --- --- • 7 --- ---
RAPDRandomly Amplified Polymorphic DNA gel A B -- -- -- indiv A • arbitrary 10bp primers target sequences flanked by inverted repeat primer sites • permits multiple annealing throughout all three genomes • coding & non-coding regions; single- & multi-copy DNA • inherited as a dominant (cannot distinguish htz from hmz) indiv B
AFLPsAmplified Fragment Length Polymorphsims • cut DNA with pair of enzymes: one rare cutter & one common cutter • attach known DNA sequences to the products • amplify products using the known sequences as priming sites • rather like RAPDs but much more reproducible • dominant inheritance
(GA)7 flanking flanking pri. pri. GAGAGAGAGAGAGA flanking flanking pri. pri. GAGAGAGAGA (GA)5 Microsatellites(SSRs: Simple Sequence Repeats) • Short (1-6bp), tandem repeats (10-50 copies) • Mono- to tetra-nucleotides, e.g. (AT)n • Random distribution assumed • Primers designed for conserved flanking regions • Variation in repeat number polymorphism • Co-dominant inheritance