Download
1 / 24
260 likes | 440 Vues
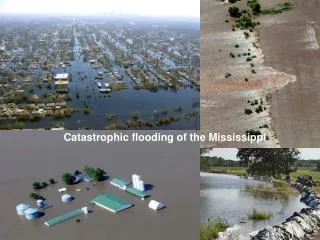
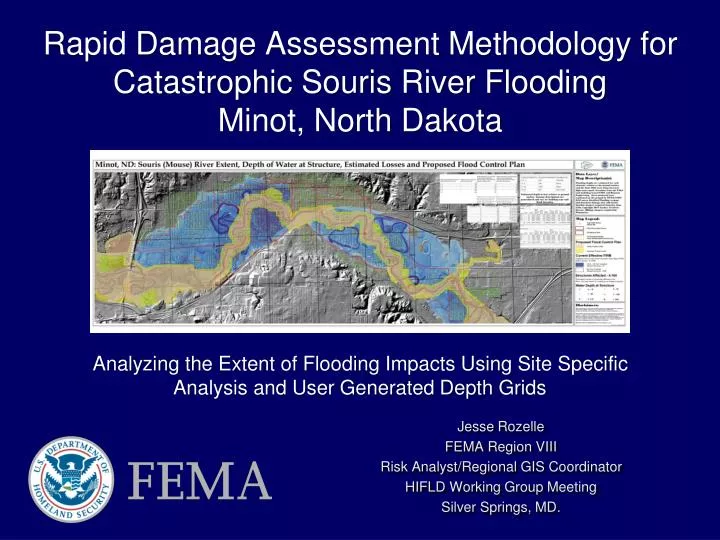
Rapid Damage Assessment Methodology for Catastrophic Souris River Flooding Minot, North Dakota. Analyzing the Extent of Flooding Impacts Using Site Specific Analysis and User Generated Depth Grids. Jesse Rozelle FEMA Region VIII Risk Analyst/Regional GIS Coordinator

E N D
Rapid Damage Assessment Methodology for Catastrophic Souris River FloodingMinot, North Dakota Analyzing the Extent of Flooding Impacts Using Site Specific Analysis and User Generated Depth Grids Jesse Rozelle FEMA Region VIII Risk Analyst/Regional GIS Coordinator HIFLD Working Group Meeting Silver Springs, MD.
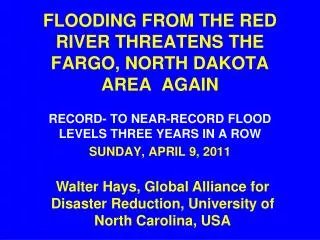
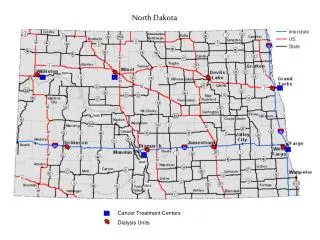
Souris (Mouse) River Geographical Context • Headwaters in Southeastern Saskatchewan, Canada. Water controlled by the Alameda Rafferty Dam project. • Water flows southeast into North Dakota, water controlled by the Lake Darling Dam. • Approximately 20 miles southeast of Lake Darling is the city of Minot, North Dakota (2010 pop.- 40,888) • Water flows southeast for roughly another 20 miles and then flows in a northeast direction into southwestern Manitoba, Canada • 700km (435mi) in length and drains an area of 61,100km2 (23,600mi2).
2011 Flood Event Overview Physical influence behind Souris (Mouse) River flooding: • Historic snowpack within Souris River Basin and surrounding drainages. • Rapid spring snowmelt • Heavily saturated soils • Reservoirs at full capacity • Multiple severe rainfall events Souris (Mouse) River: • Dam Controlled Seasonal Average Flow • ~200 to 2,000cfs • 100yr floodplain = 5,000cfs • 2011 Flooding Event • Peak Flow Recorded June 26th • ~ 24,000cfs
Minot Flood Information Timeline USGS RTK-GPS Survey-Daily Updates ImageCat Damage Assessments Completed USGS Survey-Fall Back Levee Protection Continued Support for IA and PA Inspections Flood Crest 1,561.8’ Sunday June 26th Pictometry Oblique Imagery Acquisition Pictometry products available Pre-event inundation modeling Residents Return -1wk -1day 0 +2days 1week 2weeks +3 weeks Flooding/Mandatory Evacuations June 22nd to July 10th
Task 1: USGS HWM MA • Utilized RTK GPS to provide daily measurements of water surface +/- 0.1’ accuracy • Ground-truthed pre event lidar-based inundation modeling rather than creating IDW-depth grid from scratch • Small expert USGS field team deployed from MT and WI working with ND office • $26,000 total MA costs or $6 per damaged structure to provide accurate water depths at each structure relative to ground surface
Task 2: Oblique Imagery • Contracted through USGS Rolla Mission Assignment • High res (6 inch-5 way) product with pre-event available • Ability to measure depth of water relative to finished floor • Shared with community through a public website (minot.skygone.net) • Not available for response but excellent to ongoing inspection validation • $35,000 or $8.50 per impacted structure
Task 3: Imagery Exploitation • Contract with ImageCat • Engaged Catastrophe Assessment Network (CAN) analysts in academia and outside U.S. • Completed in 3 days over July 4th weekend • Joined assessments with parcel and IA data • Completed detailed assessment of large loss structures (schools, significant facilities) • $35,000 or $17 per impacted structure assessed
Rapid Turnaround Damage Assessment Rapid turnaround Damage Assessment needed • Coordination with USGS to collect perishable data (high water mark collection). • Pictometry Oblique Arial Imagery • New Light/ImageCAT Damage Assesment Damage Assessment Accomplished using the following: • Digital Globe Satellite Imagery • Houston Engineering • FEMA Region VIII Risk Analysis Team Near Real Time Results: • Number of structures impacted by flood event • Approximate depth of water at each impacted structure • HAZUS site specific derived financial impacts • Established an SOP(Standard Operating Procedure) for rapid turnaround Damage Assessments.
Rapid Turnaround Damage Assessment USGS High Water Mark Collection • Preliminary inundation maps were produced for anticipated peak flows and sent into the field • USGS captured locations (using Real Time Kinematic (RTK) GPS techniques) of the temporary levees and high water marks used to calibrate inundation depth model.
Rapid Turnaround Damage Assessment Pictometry Oblique Arial Imagery • Captures 5 angles of oblique imagery, including orthophotos • Assisted in obtaining structure attributes required for HAZUS financial loss estimation
Rapid Turnaround Damage Assessment ImageCat New Light Technologies • Assisted in flood exposure development • Determined occupancy types of structures in flooded area • Residential basement identification as well as number of stories • Flood depth protocols • Identified priority areas for response • Rapid online product development to support widespread interpretation
Rapid Turnaround Damage Assessment ImageCat New Light Technologies
Interagency Coordination/Collaboration • USGS: Perishable Data Collection (High water marks) • City of Minot: Pre-event Data • LiDAR • Pictometry • Parcel Data • Pictometry: Oblique Aerial Imagery • New Light / ImageCAT: Damage Assessment Data • Digital Globe satellite imagery • Houston engineering: Depth Grid development • NOAA: Stream Gauge Monitoring
Pre Event Data Collection • Most critical component to Rapid Turnaround Damage Assessment • Coordination with community • Coordination with private sector • Coordination with Federal, State, Local, and Tribal partners • Rapid evaluation of population and building exposure to flood event • Publically publishedmaps gave displaced citizens a opportunity to understand the flooding situation
Questions? Jesse Rozelle Jesse.rozelle@fema.dhs.gov 303-235-4786