Download
1 / 22
220 likes | 456 Vues
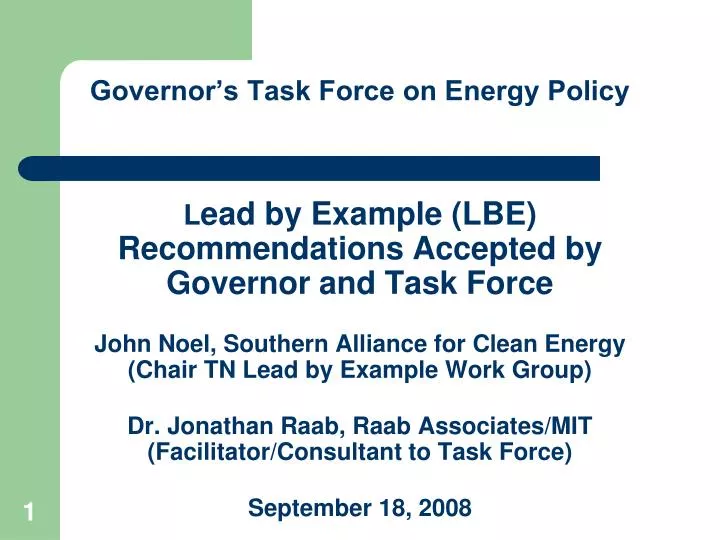
Governor’s Task Force on Energy Policy L ead by Example (LBE) Recommendations Accepted by Governor and Task Force John Noel, Southern Alliance for Clean Energy (Chair TN Lead by Example Work Group) Dr. Jonathan Raab, Raab Associates/MIT (Facilitator/Consultant to Task Force) September 18, 2008.

E N D
Governor’s Task Force on Energy PolicyLead by Example (LBE) Recommendations Accepted by Governor and Task ForceJohn Noel, Southern Alliance for Clean Energy (Chair TN Lead by Example Work Group)Dr. Jonathan Raab, Raab Associates/MIT (Facilitator/Consultant to Task Force)September 18, 2008
Recommendation Development Process • Governor’s LBE Work Group (met several times) John Noel, Chair, Southern Alliance for Clean EnergySenator Rosalind KuritaRepresentative Les WinninghamMichael Vandenbergh, Vanderbilt University • Also met several times with F&A/GS LBE WG, and Dr. Raab met individually with F&A, GS, UT, TBR managers and senior staff
General Issues:State Energy Expenditures (2007) • In 2007, Tennessee spent $151-178 million on energy. This is likely to increase to more than $200 million in 2008, due to higher fuel prices. • Buildings ($129 million) – • General Government (25 agencies): $62 million • University of Tennessee: $32 million • The Board of Regents: $35 million • Vehicle Fleets($22-$49 million) – • Fuel costs (General Services and TDOT): $22 million • Employee vehicle reimbursement costs: $27 million* * Employee vehicle reimbursement costs include cost for fuel, maintenance and vehicle depreciation. 3
General Issues:Organization 4 Organizational Changes Needed Responsibility for energy issues is distributed among numerous entities and individuals; 27 agencies are currently involved (see next slide). Consolidate energy activities with strong centralized leadership to coordinate and oversee energy policy development and implementation, including LBE activities, retrofits, and operations. Reorganize staffing resources to better manage state energy use and to lead by example to assist citizens and businesses in better managing their use. Elevate and incentivize energy issues in state government and better coordinate among agencies and campuses as well. Take advantage of potential partnerships with non-profit energy groups, other states, TVA, ORNL, EPA, DOE, and private sector.
State Buildings: Targets 6 Set targets for energy use reduction in buildings, including an explicit baseline Proposed Target: Reduction of total energy use in state buildings by an average of 15% by 2011 and 25% by 2013, as compared to 2007 usage (on a btu per ft2 basis).
State Buildings: Tracking & Reporting 7 • In general the state does not track its energy usage (certain agencies/institutions do track energy costs). • Tracking and reporting energy usage are essential first steps in energy management. • Track, benchmark and report energy usage in all state buildings at the building, campus, and department levels. • Separately meter all buildings where possible to enable energy tracking at the building level.
State Buildings: Retrofitting Existing Buildings 8 • Develop a strategy to identify, prioritize and retrofit cost-effective energy efficiency measures in all state owned buildings. • Focus primarily on a comprehensive and audit-based “whole building” approach. • Retrofits of the Andrew & Rachel Jackson state buildings in Nashville (1997-2004) resulted in a 42% electricity savings and 55% savings across all fuels. Total project cost was $4 million, and has resulted in annual savings of more than $800,000/year. • Also identify and implement a limited number of prescriptive measures that are generally always very cost effective in all buildings as soon as possible (e.g. LED exit signs, CFLs)
State Buildings: Building Energy Retrofit Strategy Proposal 9 • Develop a comprehensive and standardized plan to audit, design, construct, and implement building retrofits with a “whole building view” or “bundling” of energy retrofits. • This could be achieved by contracting with qualified energy service companies (ESCO’s) or using a Construction Management At Risk approach, or other similar process that combines state oversight and outside expertise • $85 million in state bonds for 5-year effort under discussion, plus potential utility “commercial” incentive programs
State Buildings:Cost-Effectiveness Metric 10 Current practice of requiring at least a 5-8 year payback is a barrier to better energy management Many other states utilize either longer payback periods (e.g. 15-20 years) or life-cycle costing. Change current cost-effectiveness metric
State Buildings:Building Operating Guidelines 11 • Promulgate energy guidelines for all state buildings and campuses to adhere to, including: • Summer and winter temperature settings; • Water heating temperatures; • Expectations for lighting and heating/cooling during unoccupied hours. • Give building managers some flexibility for extenuating circumstances.
State Buildings:New Construction 12 • State’s Sustainability Guidelines for new construction and major capital improvements require ASHRAE 2004 standard • Move to higher ASHRAE standards on regular and automatic cycle (e.g., 3 year ASHRAE cycle, with 1-2 year lag) • Enhance Sustainability Guidelines to ensure the pursuit of cost effective energy efficiency measures above and beyond building codes (e.g., 20-30%)
State Buildings:Equipment and Appliances 13 • Immediately require ENERGY STAR labeled products (where available) for all new appliance and equipment purchases for use in state buildings and campuses. • 17 states already require Energy Star purchasing. • Evaluate the possibility of requiring agencies to purchase EPA Water Sense labeled products, where applicable.
State Buildings:Renewable Energy and Cogeneration 14 Assess on an on-going basis opportunities to cost-effectively integrate renewable energy technologies (e.g., passive solar, solar water heating, photovoltaics, wind, and geothermal) into new and existing state buildings. Assess cogeneration/combined heat and power, and solar hot water heating opportunities at state buildings and campuses over the next year, and begin to implement these technologies where appropriate. Explore the feasibility of participation in TVA’s Generation Partners program.
State Buildings:Leased Space 15 Leased buildings confront different barriers to energy management than state-owned buildings. Develop a comprehensive strategy for reducing energy use in state-leased buildings Develop a methodology for fully incorporating energy costs in comparing and selecting lease options, and a way to ensure that leased buildings are operated as efficiently as possible. Leased space should be close to mass transit where available.
State Buildings:Funding and Staffing 16 Full implementation of these recommendations will require funding as well as extensive initiative, coordination, and key professional staffing. Put together a funding and staffing plan to establish the leadership and accomplish the recommendations.
Fleet Management:Fuel Demand and Fuel Supply 18 State owns ~10,000 vehicles (85% GS and TDOT, 15% UT and Board of Regents). 2007 fuel expenditures for state fleet were $22 million (expected to be higher in 2008). Energy policy for fleet management involves reducing the amount of fuel used (demand) and substituting preferable fuels (supply) for petroleum. Reducing demand will save money and should be the state’s first priority.
STATE FLEETS: BREAKDOWN OF PASSENGER VEHICLES BY VEHICLE CLASS Fleet Management: Breakdown of Passenger Vehicles by Class * % of GS/TDOT/Total includes passenger vehicles only
Fleet Management:Recommendations (1) 20 Departments should meet the 2010 20% petroleum reduction target established in Public Chapter 489, and an additional 25% by 2015 Increase purchases of fuel efficient vehicles in every vehicle class, and expand relatively small fleet of compact and sub-compact vehicles. Require departments to justify requests for any passenger vehicle larger than a compact. Incorporate fuel costs into new vehicle purchase decisions in every class using a “life cycle”- based method.
Fleet Management:Recommendations (2) • Design and implement a system to dispatch the most efficient vehicles first from state motor vehicle pools. • Develop plans to reduce VMT in state-owned vehicles through expanded use of technology and coordinated ride-sharing and van pooling, and from employee commuting • Regularly update and enforce best practice maintenance schedules and techniques to minimize energy use in vehicle operation.
Fleet Management:Recommendations (3) • Provide information to state employees about efficient driving practices through state-of-the-art information campaigns and/or driver training programs. • Expand E85 and B20 refilling pumps strategically throughout the state, and better align managers and employees incentives to utilize the refilling pumps. • Design and implement a data-based monitoring system for state vehicles to ensure maximum compliance with vehicle related efficiency and alternative fuel policies and procedures.