Download
1 / 33
330 likes | 532 Vues
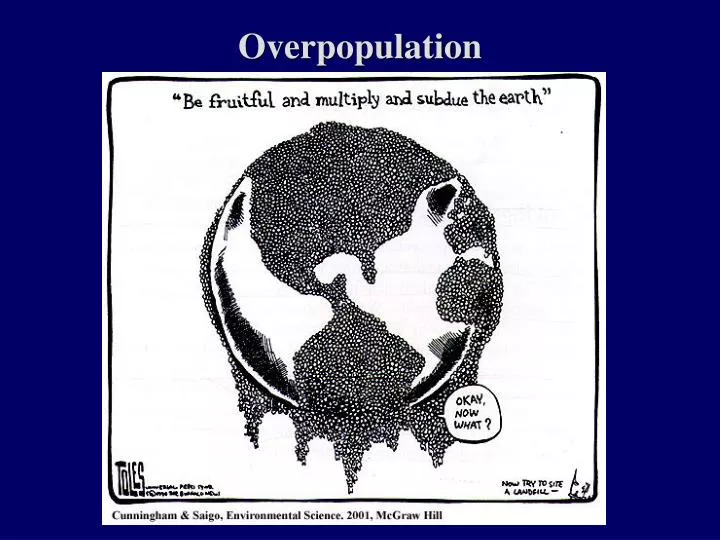
Overpopulation. Issues to Be Considered. Population Growth – fertility rates, social and cultural roles, government roles Economic problems – debt, hunger and starvation Available resources – renewable (time frames), non-renewable Consumption – expectations, reality

E N D
Issues to Be Considered Population Growth – fertility rates, social and cultural roles, government roles Economic problems – debt, hunger and starvation Available resources – renewable (time frames), non-renewable Consumption – expectations, reality Urbanization – trends, benefits, problems
How Do You Transition from One Type of Population Dynamic to Another?
Demographic Transitions How does an expanding population become a stable population (i.e., change from an r-strategy to a K-strategy)? In an r-strategy stable population both the birth rates and the death rates are high. If the death rate decreases because of better food/medical/sanitation procedures, the population grows. With technological development the birth rate drops (female education? investment in offspring?) In mature high technology society the birth rates and death rates are low, producing a K-strategy stable population.
Estimates of Most Populous Countries in 2025 Ratio* = 2025:1950
Top 10 Cities of the Year 1000 Name Population1. Cordova, Spain 450,0002. Kaifeng, China 400,0003. Constantinople (Istanbul), Turkey 300,0004. Angkor, Cambodia 200,0005. Kyoto, Japan 175,0006. Cairo, Egypt 135,0007. Baghdad, Iraq 125,0008. Nishapur (Neyshabur), Iran 125,0009. Al-Hasa, Saudi Arabia 110,00010. Patan (Anhilwara), India 100,000
Estimates of Most Populous Countries in 2025 Ratio* = 2025:1950
Top 10 Cities of the Year 1950 Name Population1. New York, United States 12,463,0002. London, United Kingdom 8,860,0003. Tokyo, Japan 7,000,0004. Paris, France 5,900,0005. Shanghai, China 5,406,0006. Moscow, Russia 5,100,0007. Buenos Aires, Argentina 5,000,0008. Chicago, United States 4,906,0009. Essen, Germany 4,900,00010. Calcutta, India 4,800,000
Top 10 Cities of the Year 2000 Name Population1. Tokyo, Japan 28,000,0002. Mexico City, Mexico 18,100,0003. Bombay, India 18,000,0004. Sao Paulo, Brazil 17,700,0005. New York, United States 16, 600,0006. Shanghai, China 14,200,0007. Lagos, Nigeria 13,500,0008. Los Angeles, United State 13,100,0009. Calcutta, India 12,900,00010. Buenos Aires, Argentina 12,400,000
How to achieve demographic transition? Family planning in Thailand - example of success Annual population growth dropped from 3.3% in 1972 to 1.2% in 1995. Mechai Viravaidya, founder of Community-Based Family Planning Service (CBFPS). Focused on wants and needs of poor.
How did Thailand Accomplish Transition? • Celebrity • Humor/break taboos of contraception • Condom give-a-ways • Financial incentives • Reduced infant mortality due to infectious diseases - clean water supply • Altered desired number of children (from 8 to 3)
Contrast Thailand with China In China, population control is a political outcome Women must receive “birth coupons” prior to conception Mass murders of girl babies Abortions (even at 9 months gestation) Women of reproductive age examined and monitored
World Population While demographic transition is occurring in many places, the world population keeps increasing at a rate of about 1.5% to 2% per year. So the doubling rate is between 35 and 46 years!
Population Growth - Optimistic • Growing prosperity will reduce desire for large families. • Technology/communication will spread information faster, making transition more rapid than it occurred for more developed countries. • Fertility rates are dropping and populations are stabilizing (except in Africa).
Population Growth - Pessimistic • Demographic trap: poorer countries will not become developed enough for birth rate to be reduced, causing population growth rates to remain high. Catastrophe will be the only regulatory control.
World Population Growth What will this mean for the planet? Will we alter the human carrying capacity by our impact? What can we do to help stabilize the world’s population? What should we do?
People Overpopulation Compared to Consumption Overpopulation To put these two in context, consider the following equation: I = P x A x T where I = environmental impact P = the population size A = affluence (or consumption) T = effects of the technology used People overpopulation relates the first term - P Consumption overpopulation relates to the last two terms - A and T.
Consumption Comparisons • One quarter of the global population living in developed countries consumes for 80% of the world’s total energy. • USA alone accounts for 6% of the global population , but consumes 30% of its resources. • 20% of the global population consumes 70% of its material resources and possesses 80% of the wealth. The majority of this 20% in centered in Canada, USA, Saudi Arabia, Australia, and Japan.
Consumption Comparisons • A child born today in the United States will by the age of 75 years produce 52 tons of garbage, consume 10 million gallons of water and use 5 times the energy of a child born in the developing world. • The United States uses approximately one quarter of the world's fossil fuels and is the largest contributor of carbon dioxide, undesirable combustion products, and chlorofluorocarbons, chemicals that contribute to greenhouse warming and attack the Earth's ozone shield.
Consumption Comparisons Increasing the fuel mileage of cars by just 3 mpg would save the same amount of oil that could be tapped from the Arctic National Wildlife Refuge over 10 years. Every 20 minutes, the world adds another 3,500 human lives but loses one or more entire species of animal or plant life - at least 27,000 species per year. Population is growing faster than food supplies in 64 of 105 developing countries. Overcultivation, primarily due to population pressures, has degraded some 2 billion hectares of arable land - an area the size of Canada and the United States combined
Consumption Comparisons Globally, the demand for fresh water exceeds the supply by 17 percent already. Two-thirds of the world's population will experience some form of a severe water shortage in the next 25 years.By 2025, when world population is projected to reach 8 billion, 48 countries with a total population of 3 billion will face chronic water shortages. In 25 years, humankind could be using over 90 percent of all available freshwater, leaving just 10 percent for the rest of the world's plants and animals.
What is the Carry Capacity of the Planet for Humans? Paul Erlich – Population Bomb, 1968 – predicted 2 billion. Now at 6 billion. Julian Simon – there is no problem, more people means more potential technology solutions. Some estimate 20 billion will be maximum (at this rate, in your lifetime!!!) Solution = balance of population controls and consumption controls.