Download
1 / 41
410 likes | 552 Vues
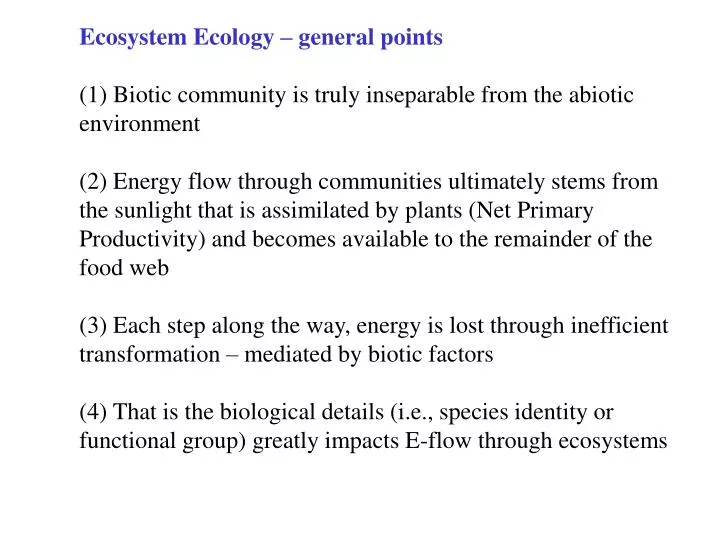
Ecosystem Ecology – general points (1) Biotic community is truly inseparable from the abiotic environment (2) Energy flow through communities ultimately stems from the sunlight that is assimilated by plants (Net Primary Productivity) and becomes available to the remainder of the

E N D
Ecosystem Ecology – general points (1) Biotic community is truly inseparable from the abiotic environment (2) Energy flow through communities ultimately stems from the sunlight that is assimilated by plants (Net Primary Productivity) and becomes available to the remainder of the food web (3) Each step along the way, energy is lost through inefficient transformation – mediated by biotic factors (4) That is the biological details (i.e., species identity or functional group) greatly impacts E-flow through ecosystems
Cont’ (5) Nutrient availability mediates E-flow through ecosystems because nutrients NOT energy may be most limiting (6) Nutrient (water, C, N, P) flow through ecosystems is largely under control of large-scale geological processes (7) But, the role of individual organisms/species, while often trivial in terms of global impact, is extremely important in terms of its impact on the biological world
The Ecosystem Concept – A brief history Early 1910-1920’s: Clements and Gleason Biotic descriptions of communities emphasized individualistic properties – a fortuitous collection occurring together in time and space views plant communities as a superorganism 1935 Include abiotic factors
The Ecosystem Concept – A brief history 1927 Charles Elton characterized feeding relationships among animals on Bear Island, North Atlantic Emphasized energy flow coined the terms “food chain” and “food cycle” to be replaced by food web
Elton’s Pyramids As one goes up the food chain, one ascends a progression of sizes as most predators consume smaller prey; larger animals require more space to find food and hence their numbers go down. #’sBiomass 1 1kg 10 10 100 100 1000 1000
Of the total solar radiation, 0 , plants use some fraction, 1 , herbivores assimilate less energy, 2 , owing to plants maintaining themselves before being eaten and E lost during assimilation 2 1 = Biological Efficiency of the trophic link (<<1) 1942 Ray Lindeman visualized a Pyramid of Energy Transformation – less energy becomes available to higher levels due to work being done and inefficient transfer.
1953 Eugene Odum – model Energy flow, later adapted for nutrients as well • Energy flows in one direction, absorbed light is lost as heat or transferred • into chemical energy through photosynthesis (Annual Gross Primary • Production) by autotrophicorganisms. • (2) Autotrophs spend some energy to respire, other goes into growth, which • becomes available to heterotrophs at the next higher level (AnnualNet • Primary Production)
Later, nutrient flows were added: Unlike energy, nutrients are typically retained and regenerated in biological systems. There are some inputs and outputs (but rather small) and nutrients pool in some parts of the ecosystem, but mainly are transferred between various trophic levels.
Cycling of nutrients has assumed a near equal status with energy flow. • One reason is that the amounts of the elements and their movement • between ecosystem components provides an index to energy flow, which • may be otherwise difficult to measure. • Carbon in particular bears a close relationship w/energy because of its • intimate association w/photosynthesis. • Also, certain nutrients regulate Primary Production • e.g., water in deserts, N & P in oligotrohic lakes
ENERGY FLOW Photosynthesis: 6CO2 +6H2O C6H12O6+ 6O2 Or cutting, drying, and weighing of all plants at the end of the growing season – Annual Aboveground Net Productivity (AANP).
Photosynthesis – How efficient? • Light, temp, water, and nutrients all limit photosynthesis. • Plants are rarely at max (cloud cover, shading) • Rates saturate at high temp (i.e., diminishing returns) • Water loss via stomata can shut down PhotoS (Transpiration efficiency ~ 2g/kg water). For the ecosystem, efficiency is ~ 1-2%. Plants reflect 25-75% of incoming light and another large percent is absorbed by other molecules and lost as heat. Finally, nutrient availability affects plant productivity …
C3 C4 CAM
Because ecosystems differ in terms of plant density, water input and availability, nutrient availability, and the uniqueness of individual spp adapted to particular environments, Annual Primary Productivity varies greatly with ecosystems.
Energy transfer between trophic levels is only 5-20% efficient Ingestion ingested E – egested E = assimilated E (mainly a function of diet) Egestion Digestion & Assimilation Energy For Detritus feeders Respiration, energy used to perform work is lost Excretion (N waste) Growth and Reproduction assimilated E – respiration = production (mainly a function of metabolic rate) Death 1-6% active, endotherms up to 75% for aquatic species plants: 30-85% Next level Ecological Efficiency is the ratio of biomass at one trophic level that is incorporated into biomass at the next trophic level.
Detritus then, often dominates food webs – at least in terrestrial systems. Herbivory rates Temp forest: 2-3% Old fields: 12% Lakes: 60-99%
Food chain lengths are ultimately limited by ecological efficiencies Community NPP Ingestion Eff n (kcal/m2/yr) (kcal/m2/yr) (%) Open ocean 500 0.1 25 7.1 (5.5) Coastal marine 8000 10 20 5.1 (6.6) Temp. grassland 2000 1.0 10 4.3 (4.3) Tropical forest 8000 10 5 3.2 (4)
Pathways of Elements in the Ecosystem – a generalization Ecosystem is broken down into separate compartments (in a hierarchical manner) or pools where elements reside. Movement between pools often biochemical transformation, often involving energy. Photosynthesis adds energy to carbon, whereas burning fossil fuels removes energy.
Global Carbon Cycle **Responsible for the imbalance in the modern C-cycle 3 classes of cycling through aquatic and terrestrial systems: (1) Assimilation/dissimilation reactions via photosynthesis and respiration (2) C02 exchange between the oceans and atmosphere (3) Sedimentation of carbonates New** #’s refers to Billions of metric tons - 1015 grams
Global Nitrogen Cycle ** in 2000 anthropogenic sources of N exceeded natural sources at 87 x 106 MT – forecast for 2020: 135 MMT; 2050: 236 MMT (pesticides - 2000: 3.75 MMT, 2050: 10.1 MMT) **
Precip + 76 kg/ha/yr E.g., of Local Nitrogen Cycle Model of N-cycling in a forest Undisturbed forest gains 1-3 kg/ha/yr 1200 Kg/ha Soil 14,000 Kg/ha Tropical Forest in Ghana: 1794/4587
Model of N-cycling in a forest (disturbed Forest) Precip + 76 kg/ha/yr Fire (wind) Clear-cut - 54kg/ha/yr Large blow-downs • Defoliating insects??? • recovery is quick • trees remain alive • no soil erosion Soil
Insect defoliation and N-cycling in forests Gypsy moths are an introduced insect pest that experiences occasional outbreaks in which huge swaths of oak forest are entirely defoliated
Fate of Foliar N (15N-labeled exp) Normal Outbreak Resorption (fall) 70% 23 -47 Fall leaf drop 25 17 (new) -8 Early green leaf drop 1.4 29 +28 Leaching 2 4 +2 Insect Biomass 0.7 8 +7 Frass 1 23 +22 N has very different fates – Frass/insects biomass at the expense of resorption
What is the fate of foliar N consumed by insects and deposited as green fall?? <0.1% Gaseous N Assimilated: 16% Frass: 84% N 100% N
Frass: Scatological Research Team – 9% organically extractable 91% salts, such as uric acid Frass is readily consumed/broken down by microbes, which immobilizes N in microbial biomass Oak litter: 81% N recovered, mostly as undecomposed leaf litter. Frass: 40% recovered, almost all of it through the soil
But, defoliation disrupts normal N-cycling through soil-plant systems Litter N is released from leaf litter slowly via decomposition, whereas … Frass N moves quickly into the subsoil where it is retained as organic matter in mircobial biomass and released more slowly into the soil pool of N. As a consequence, short-term effects of Gypsy moth outbreaks have a small effect on N-cycling through the forest, however, chronic outbreaks/defoliation can lead to heavy leeching, depletion of soil N and high concentration of NO3 and NO2
Punch line – species are intimately tied to the cycling and transfer of Energy and Nutrients through ecosystems. E.g., #1 – Photosynthetic rates E.g., #2 – Assimilation rates/ecological efficiencies E.g., #3 – Impacts of gypsy moths on N-cycling Will the loss of species richness from communities severely impact ecosystem processes ?
Will the loss of species richness form communities severely impact ecosystem processes ? 3 Hypotheses redundant Ecosystem Process/service e.g., productivity, pollination idiosyncratic Non-substitutable Species richness
Ecosystem Process, e.g., productivity Species richness Non-substitutable implies that every species is unique and its Effects/impacts cannot be substituted by others.
Ecosystem Process, e.g., productivity Species richness Redundancy implies that every species can partially compensate for each other’s absence, and that there is diminishing returns to species diversity in terms of their ability to supply ecosystem services – i.e., not all species are necessary for a fully functional ecosystem
Ecosystem Process, e.g., productivity Species richness Idiosyncratic implies that each unique combination of species has its own level of ecosystem service provision and is not predictable a priori
Why should there be a positive correlation be ecosystem service and species richness? Ans #1: Sampling artifact. By chance, a larger group of species is more likely to contain the MOST productive species than a small group. Never exhibits over-yielding, that is, no group of species can ever outperform a monoculture of the best single species Productivity A, B, C individually group
Why should there be a positive correlation be ecosystem service and species richness? Ans #2: Niche- complementarity – competition theory: species will evolve to be distinct and thereby reduce or eliminate competition. e.g., root profiles
Because a group of species can more effectively harvest water, productivity of the group is enhanced over any single species C B Vs. A Exhibits over-yielding Productivity A, B, C individually group
Decomposition of leaf packs in Williamstown, MA .3 .2 K-value (decomposition rate) .1 0 -.1 Lonicera maple beech hemlock
The implication is that a world dominated by Lonicera releases large amounts of organic matter quickly, but little remains for the end of the growing season. Therefore, diversity/richness of stream invertebrates is reduced in systems with reduced canopy cover nutrient availability time Lonicera maple beech hemlock
Species diversity/richness and temporal variability • Two lines of thought: • Insurance Hypothesis – rare species are extremely • important under extreme conditions. • (2) Portfolio Effect – More diverse portfolios are less volatile • because, several randomly and independently variable • “items” are less variable than the average item Services provide by the groups of species include: stability (the inverse of variability), function during extreme events (e.g., drought resistance), ability to resist invasion
Plant biomass (% cover) and soil denitrification rates (less soil nitrate) increase with species richness
Plant biomass shows greater resistance to drought when species richness is higher Rare spp response
Loss of species is a concerned because the Earth’s biota performs many valuable functions and services Valuing species richness and diversity Aesthetic Research and Development Economical Service (and $$$)