Download
1 / 15
150 likes | 282 Vues
Examining regional model output on different spatial scales using an isotropic digital 2d filter. Frauke Feser and Hans von Storch Institute for Coastal Research GKSS Research Center, Geesthacht, Germany. Well resolved. Insufficiently resolved. Global Model. Variance. Regional Model.

E N D
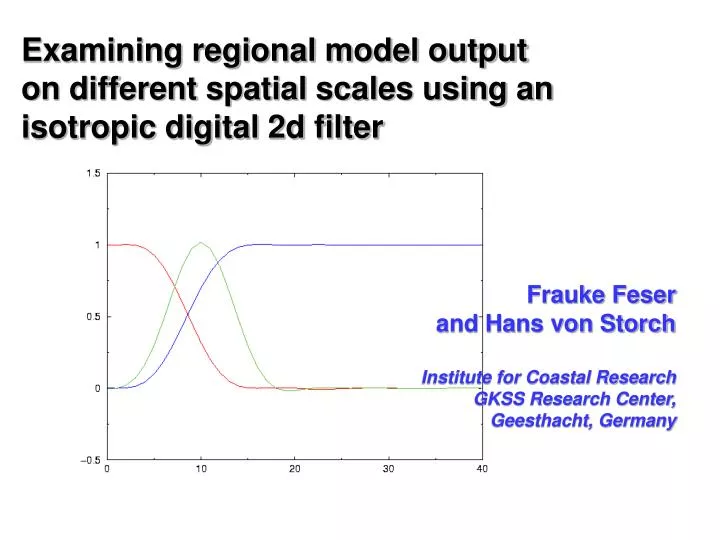
Examining regional model output on different spatial scales using an isotropic digital 2d filter Frauke Feser and Hans von Storch Institute for Coastal Research GKSS Research Center, Geesthacht, Germany
Well resolved Insufficiently resolved Global Model Variance Regional Model Insufficiently resolved Well resolved Spatial Scales Added Value
The construction of a 2d digital filter : The filter array should be isotropic, i.e., the response function should be the same for the same wavelength, independent of the direction. The filter should suppress most of the variance on certain frequency bands, while retaining almost all variance on others. We have constructed an algorithm which determines an optimal set of filter weights so that the response approximates for wavenumbers k - with 0≤k≤k1 and k2≤k≤kmax: (k) 0- with k1≤k≤k2: (k) 1 Feser, F., and H. von Storch, 2005: Spatial two-dimensional discrete filters for limited area model evaluation purposes. Mon. Wea Rev. (accepted)
Response functions for fitted optimal low pass, medium pass and high pass filters Example: Filters for a limited area of 81 grid points in zonal and meridional direction. The symmetrical filter base is made up of 2*8+1 filter weights in zonal and meridional direction. Here, the response functions is shown only for the „waves“ with directions in the E/N quadrant.
Application of filters • Analysis of 43 year simulation of REMO-SN (spectrally nudged REMO) with NCEP large scale control. 50 km grid • The case of a snapshot, showing an example of filtered fields • Statistics of filtered fields: long term mean (stationary components) and long term standard deviation (time variable components) • Comparison of time variable components with a) high quality analysis prepared by German Weather Service DWDb) with driving NCEP analyses after suitable fine grid interpolation
A case of a field subject to the three filters Full field Low pass High pass Medium band pass Zonal wind component at 10 m height
Low pass Full fields Time mean distribution (stationary component) of filtered 10m wind speed in DJF 1992-1999 Medium band pass High pass
Low pass Full fields Distribution of standard deviation (time variable component) of filtered 10m wind speed in DJF 1992-1999 Medium band pass High pass
Validation of medium scale variability –comparison of standard deviations simulated by REMO-SN with high quality DWD analysis DJF 2m air temperature JJA Ratios of standard deviations REMO-SN/DWD, in %
Added value provided by RCM: Increased medium-scale variability DJF 2m air temperature JJA Ratios of standard deviations REMO-SN/NCEP, in %
Summary and outlook: A two-dimensional almost isotropic digital filter was created for low, medium and small scales; the algorithm is applicable for model grids of miscellaneous resolution and size. Pre-processing by subtracting a fitted polynomial is often required (not shown). Results show effective scale separation. Medium scale variability greatly increased in downscaled (REMO-SN) reconstruction 1959-2002 compared to driving NCEP analysis – ADDED VALUE Feser, F., and H. von Storch, 2005: Spatial two-dimensional discrete filters for limited area model evaluation purposes. Mon. Wea Rev. (accepted)
Top: K=1,2-polynomials Pu1 and Pu2 fitted to the wind speed field [m/s] at a height of 10 m on December 3rd, 1999, 6 p.m. (storm 'Anatol'). Bottom: Full wind speed field for the same date, and after subtraction of the K=1,2-polynomials i.e., u - Pu1 and u - Pu2.
Low pass filter Filter weights (N=8) for : High pass filter Medium pass filter
Filtering of a finite, non-periodic field. Digital filtering With certain constants αk. Δ represents the grid distance. Note that the filtering calculates a weighted average of the „base point“ f(x) and its K neighbors to the right and to the left. At the interval ends this causes problems. However, in case of regional modelling at the interval ends are irrelevant because of the „sponge zones“. The width of the sponge zone is typically 10, so that K = 10 is a useful choice. When the digital filter is applied to a spectrally represented function The filtered function f* may be written as with the „filter characteristic“,or „response function“