Download
1 / 21
210 likes | 345 Vues
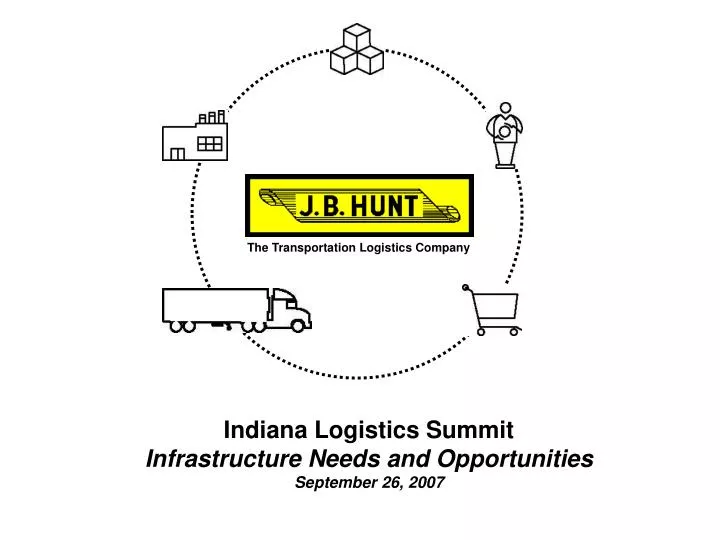
Indiana Logistics Summit Infrastructure Needs and Opportunities September 26, 2007. TRANSPORTATION INFRASTRUCTURE. Trucking’s Progress Since 1985. ATA’s Monthly Truck Tonnage Index (1993 = 100). 6% Average Annual Growth Rate. Trend Line. Source: American Trucking Associations.

E N D
Indiana Logistics SummitInfrastructure Needs and OpportunitiesSeptember 26, 2007
Trucking’s Progress Since 1985 ATA’s Monthly Truck Tonnage Index (1993 = 100) 6% Average Annual Growth Rate Trend Line Source: American Trucking Associations
Land Capacity: Congestion 2020 Estimated Peak Period Capacity Sources: US Department of Transportation, Federal Highway Administration
Only 4% of the Market Has More Than 20 Trucks, but We Believe That 4% Controls ≈70% of the Capacity Represents 613,242 fleets, including owner-operators with operating authority. Sources: Motor Carrier Annual Report, TT Press and American Trucking Trends 2005 by ATA.
Demographics Remain Unfavorable for Significant Driver Additions Source: U.S. Census Bureau
Ugly Demographics Will Persist Past 2010 • Males, ages 20-44: 52.3 mil. in 2000; 52.7 mil. in 2010; 0.1% CAGR • Females, ages 20-44: 51.8 mil. in 2000; 51.7 mil. in 2010 • At 3% GDP growth, driver availability would be 34% worse by 2010 • Males, ages 20-34: 0.4% CAGR, going from 29.9 mil. in 2000 to an estimated 31.1 mil. by 2010--the “only hope”--demographic is still growing at less than half the rate of GDP growth • Average age of a Teamster driver is 57 years--Yikes! • 209,000 of 1.3 million long-haul drivers retiring in next 8 years
Congestion issues are increasing Source: J.B. Hunt Transport, Inc.’s over-the-road shipments during October of each year
HOS - When do drivers drive? • Drivers drive during the normal work day hours • By 5:00 pm, 90% of a driving hours are expired 90% of the daily driving capacity is consumed by 17:00 each day
Policy Ideas to Improve Highway Congestion • Day of Week • Time of Day • Lane Restriction • By Vehicle Type • Increase Weight Limits • Increase Trailer Lengths • Expand Highways
Change the Weight Laws • 80,000 lbs. gross to 96,000 lbs. gross • Gain +20% • Safety Issues – Stopping distance • 79% of our JBHT freight would not apply • Increased road maintenance • Capital investment by the trucking industry?
Change Length Laws • 53’ – 57’ Trailers +7.5% cubic • Double Trailers “Twins” • Safety: Training of Drivers, Turning, Lane Changes, Backing • Road Infrastructure • Urban Areas – Docking problems • What roads would allow them? • Capital Investment by trucking industry
Increase Highway Infrastructure • 2 Lanes 4 Lanes • 4 Lanes 6 Lanes (Most interstate highways) • 6 Lanes 8 Lanes • 8 Lanes 10 Lanes Cost: $ $ $ Billions Time to Rebuild Setting Priorities
Re-Engineer Of U.S. Shippers Supply Chains • Mode conversion: • Truck → Intermodal • Truck → Dedicated • Less plant transfers – more customer direct shipping • Improved packaging • Better cube fill in trailer • All water shipping to east coast ports • Increase use of ocean containers staying intact • Shippers are manufacturing products closer to their customers • Customers are taking miles/loads out of the supply chain
Freight Mix? What will the freight mix look like in 5, 10, 15 years?
Elements of Rail Capacity • Vehicles (locomotives and cars) • Line-of-road (alignment, signal systems, number of tracks) • Terminals (location and capacity) • Operating Plan • People • Execution
Possible Solution • Have 5-15 year plan on building 15-20 new Intermodal terminals • Have Government Assistance • Site location • Environmental issues • Financial - Industrial bonds, tax incentives, etc.) • Benefits • Highway congestion – reduces pressure on highway expansion • Economical – Best return on a dollar spent • Helps Greenhouse issues • Saves Fuel 3:1 • Help the trucking industry recruit drivers – more local jobs
Summary: What’s the Best Solution? • Combination of Rail and Highway Rail InfrastructureHighway Infrastructure Terminal ExpansionEspecially Urban Areas
Thank You Always Buckle Up and Please Drive Safely!