Download
1 / 33
350 likes | 964 Vues
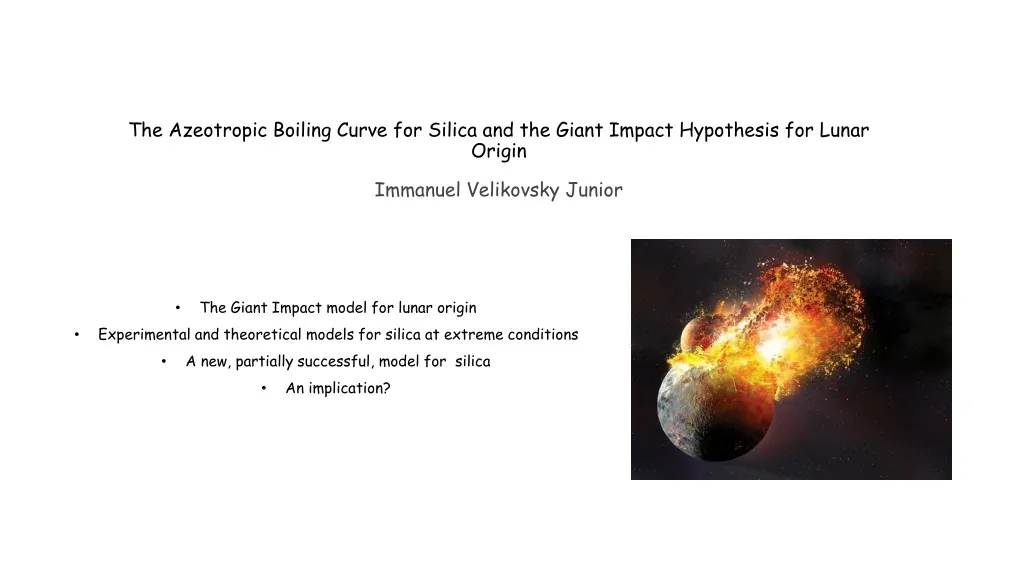
The Azeotropic Boiling Curve for Silica and the Giant Impact Hypothesis for Lunar Origin Immanuel Velikovsky Junior. The Giant Impact model for lunar origin Experimental and theoretical models for silica at extreme conditions A new, partially successful, model for silica An implication?.

E N D
The Azeotropic Boiling Curve for Silica and the Giant Impact Hypothesis for Lunar OriginImmanuel Velikovsky Junior The Giant Impact model for lunar origin Experimental and theoretical models for silica at extreme conditions A new, partially successful, model for silica An implication?
Impact phase relations Supercritical Fluid Vap Liq s => entropy v => volume
10000 K The Standard Impact Model (pre-2013, e.g., Canup 2004) The day after, temperature, orthogonal to the disk plane Provenance, in the disk plane Small (mar-sized), low velocity impactor needed to reproduce the angular momentum of the Earth-Moon system Obliquity constrained by lunar mass 2000 K impactor earth The ejected material originates primarily from the impactor, but the Moon’s isotopic composition is identical to that of the Earth’s Mantle
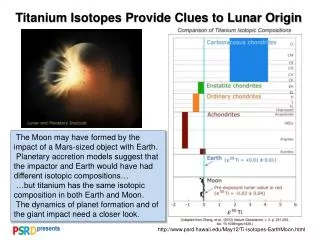
the rain-out model fails to reproduce Si isotopic composition the model is too fancy for it’s own good, T can’t be raised because they want to fit highly uncertain chemistry (XMg from Khan et al. 2006) Stevenson’s (1987) solution: post-impact re-equilibration Pahlevan et al (2011) version of the solution: A week of post-impact turbulent convection homogenizes the earth-mantle proto-lunar disk system
At 1 bar various mad scientists have located the boiling point somewhere between 2200-3200 K What is known about silica boiling I More manageable temperatures (1400-2000 K) by working in a low pressure Knudsen effusion cell Knudsen cell phase equilibria => Mysen & Kushiro (1988) Locate boiling curve at 10-5-10-4 bar Extrapolates to 3100±150 K at 1 bar Knudsen cell mass spectrometry => Shornikov et al. (1998-2000) The gas is molecular (SiO, O2, SiO2, Si and O) Dominantly diatomic (O2, SiO2) Equilibrium constants for gas phase speciation, i.e., for SiO2= SiO + O2 SiO = Si + O2 O2= 2O
SiO2 in the vapor, molecular, 2-fold coordination Structure of the Low T Liquid SiO2 in the liquid, ionic, 4-fold coordination SiO44- The 1 bar melting point is 2000 K, calorimetric and spectroscopic measurements are made on metastable glasses Calorimetry (Tarasov et al. 1973, Bottinga & Richet 1982) => glass heat capacity at ~1480 K is at the Dulong-Petit limit (3nR) –> harmonic oscillator Almost no difference in properties between cristobalite and melt + spectroscopy => Si is tetrahedrally coordinated -> melt cannot be molecular If there is a critical point, the structure of the ionic melt and molecular gas must converge at that point Si2O72- etc
Shock wave experiments (Hicks et al. 2006) => • strongly anomalous heat capacity that starts at the onset of melting (~4500 K on the quartz Hugoniot) • conductivity evidence for a rapid disorder from 4500-8000 K (far below the plasma transition at ~30000 K) • anomalous heat capacity is probably associated with both bond breaking suggesting the possibility that the melt becomes more molecular with T • no data for Cv on low density liquid, it is improbable that it is constant as assumed in petrological and hydrocode models Structure of the High T Liquid Ab-initio molecular dynamics (Karki et al. 2007) 3000-6000 K, density > ρMP => Si coordination number decreases with increasing volume (temperature) Cv is ~150% of the Dulong-Petit limit decreasing melt density
High T Boiling: Shock and Release Experiments (Boslough 1988, Kraus et al 2012) MANEoS Hugoniot Experimental Hugoniot Shock sample hitting it with a laser beam Monitor T by phonon pyrometry during decompression once the sample begins to boil (~5 ns) The liquid is relatively opaque so: in liquid dominated (low T/s) experiments phonons come from the uncompressed state, indicate T <= Tboil in vapor dominated systems (high T/s), the pyrometer samples the compressed state, indicate T >Tboil
ANEoS - “Mie-Gruneisen” model for fluids (Thompson 1973) A = Acold + Athermal + … Acold = ∫Pcolddv => pseudo-Mie potential (Zharkob& Kalinin 1971) => Pcold = C(fm – fn), f = ρ/ρ0 < 1, m > n Athermal=> Kormeret al. 1962 => (1-Ψ)*ADebye model solid + Ψ*Aideal monatomic gas, 0 ≤ Ψ(ρ,T) ≤ 1 Underestimates vaporization => Overestimates impact temperatures Melosh (2007, Bobrovski et al. 1974) modified ANEOS for SiO2 Aidealmonatomic gas=> Areactive diatomic-monatomic ideal gas mixture based on the SiO = Si + O partition function, the correction doesn’t define speciation rather it loosely captures its entropic and energetic consequences Parameterized to locate the critical point along the extrapolation of the low P boiling curve at which PV/nRT ~ 0.3 a prediction for single species fluids from the “law of corresponding states”, n is the moles of molecules in a mole of SiO2 fluid, i.e., 1 ≤ n ≤ 3 this prediction does not apply for mixed species and n is guessed => the parameterization assumes the answer
MANEoS II neglects (accurately known) gas speciation; assumes Dulong-Petit limit liquid heat capacity. Consequently it: overestimates the extent of melting by ca 50% Hugoniot T-s curves are 5000-20000 K too low lowers vaporization T but its accuracy cannot be assessed allows no compositional degrees of freedom, i.e., SiO2 fluid must be stoichiometric
Sowaddahamigonnadoaboutit? Van der Waals-type molecular EoS: 2-parameter cubic f(v) Redlich-Kwong EoS P = RT/(v-b) – a/vT1/2(v+b) impure fluid: a = f(yi,ai), b = f(yi,bi) need 10 parameters (aSiO2, aSiO, aSi, aO2, aO, bSiO2, bSiO, bSi, bO2, bO) + known thermodynamic properties of the ideal gas limit cannot be used at high pressure, i.e., if v < b
Pure species parameters O2 – at a critical point ∂P/∂v = 0, ∂2P/∂v2 = 0 known O2 critical conditions => 2 equations in 2 unknowns (aO2, bO2) O – approximate by aO2, bO2 Si, SiO2– at the (known) 1 bar melting points (Si, 1687 K; SiO2 1999 K) vliq = ∆vmelting + vsol gsol=gliq = ggas+ RTlnfliq Pmp= RTmp/(vliq-b) – a/vliqTmp1/2(vliq+b) lnfliq= b/(v-b) – a[1/(vliq+b) + ln{(vliq+b)/b}/b]/RTmp3/2 + RTmp/(vliq-b) SiO – guess from SiO2 by analogy with CO and CO2, aSiO adjusted to match low T oxygen solubility in Si melts
Is the a parameter temperature dependent? at high T gas species heat capacities are near constant, liquid heat capacity cannot be < the Dulong-Petit limit For RK in dense limit (vliq->b, α->0) this requires a ≥ 8RbT3/2/(3+6ln2) too strong to ignore gmelt -> aMP smelt = -∂gmelt/∂T -> (∂a/∂T) MP ∆Cpmelting = -T ∂2gmelt/∂T2 -> (∂2a/∂T2)MP => a = f(T)
Impure fluid a & b parameters b = ∑yibi – theory (virial EoS) a – assume molar weighted sum of pair-wise interactions a = ∑∑yiyi[aij] [aij] estimated by harmonic, geometric or arithmetic mean of ai & aj Experimental data (Schnurre et. al 2004) for low T, 1 bar, Si-SiO2 mixtures provide a test via the Henry’s law coefficient kSiO2 in Si melt:
The Stable Speciation in the Si-O System Speciation for a given bulk composition (e.g., SiO2) pressure and temperature is computed from 5 equations in the 5 unknown species fractions (ySiO2, ySiO, ySi, yO2, yO): Closure: ySiO2 + ySiO + ySi + yO2 + yO= 1 2) Bulk Composition: XO = nO/(nO+nSi) nO = yO + 2 yO2 + ySiO + 2 ySiO2 nSi= ySi+ ySiO+ ySiO2 3-5) Internal equilibrium by speciation reactions: SiO2 = SiO + O2, K1 = ySiOySi/ySiO2*f1(P,T,yi) SiO = Si + O2,K2= yO2ySi/ySiO*f2(P,T,yi) O2 = 2O, K3= yO2/yO2*f3(P,T,yi)
Does it work? Test I: Comparison to conventional petrologic melt model Good to ~1 GPa ρmax ~ 2350 kg/m3
MRK Does it work? Test II: Comparison to low P phase relations as function of composition Schnurre et al (2004), 2 liq EoS + ideal gas vapor
The Scales of Stevenson’s Scenario (Pahlevan & Stevenson 2007) for a 6000 K Earth • Rotation doesn’t isolate the protolunar disk • τcool = GmEmI/σsbT44πrE3 for T ~ 2000 K -> 3000 years for earth, 1000 years for the disk => decreases ~ 10 years • τconv = L2/3/(F/ρH)1/3 turnover time mantle ~ 1 week, disk, atmosphere ~ hours => decreases ~ 1 day • τexchange = σ(3kT/m)1/2Pα mass exchange at the disk/earth interface ~ several lunar masses per week => decreases to a couple of masses A lot less favorable, but τconv << τexchange and τexchange<< τcool so a first guess is that a supercritical earth model is plausible
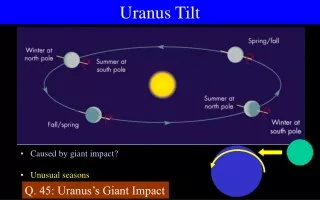
Cuk & Stewart (2012) the Earth-Moon system could have lost angular momentum through resonance with the Sun => the loss of the angular momentum constraint has spawned an avalanche of new impact models, to name a few: • Small impactor + rapidly spinning earth reanimates Darwinian fission (no chemical problems, Cuk & Stewart 2012) • Giant-giant (Earth sized) impactor averages the impactor and target mantles (no chemical problems, Canup 2012) • Hit-and-run high velocity impactor (chemical problems, but vastly hotter post-impact Earth, Reufer et al 2012) Post-2011 Impact Models post-impact Earth temperature Pre-2011 “Canonical” Model Reufer et al 2012 Hit-and-Run Model
Conclusions The MRK provides a simple model capable of both connecting silicate liquid and gas states and reconciling low P data The model can easily be extended to more complex chemical systems Non stoichiometry of silicate boiling suggests that a multiple impacts and atmospheric loss could lead to significant metal enrichment, the enstatitechondrite Si/SiO2 ratios are consistent with the azeotropic composition of the MRK SiO2 boiling curve The MRK critical point is at similar T to that of the MANEOS, Stevenson’s (1987) post-impact equilibration scenario remains plausible for a super-critical Earth
The Microscopic Structure of the Liquid 1 bar MP 2000 K Calorimetry (Bottinga & Richet) => Cp_glass = 3nR -> the DP limit at 1480 K – Harmonic Os Almost no difference in properties between Cristobalite and Melt, Si is tetrahedrally coordinated, the Melt must be ionic! Ottonello et al (2010) explain these observations with a model in which a crystal-like network of Si4O8 units is interpersed with liquid like SiO4= in 2:1 proportions. The 1R Cp_glass-Cp_liq jump is due to rotational-translational degrees of freedom. Flat Cp justified by partial molar Cp to ~1800 K Many other models, but any model with Si CN > 2 implies ionic species Ab-Initio MD study (Karki et al 2007): CN decreases with increasing volume (temperature) Cp is 150% of the DP limit Calculations at high T, but only at high density (rho>rhomeltingpt)
The Microscopic Structure of the Liquid II Shock wave expts (Hicks et al 2006) indicate a strongly anomalous heat capacity that starts at the onset of melting (~4500 K on the qtz Hugoniot) Primarily temperature dependent, conductivity evidence for a rapid disorder from 4500-8000 K (far below the plasma transition at ~30000 K) => Low T silica melt is ionic, CN > 4 It has strongly anomalous Cp (150% CDP) that is probably associated with both bond breaking, at low pressure increase in T correlates inversely with CN, suggesting the possibility that the melt becomes more molecular. There is no data for Cv on low density liquid, it is improbable that it is constant as assumed in petrological and hydrocode models
Shock and release experiments Shock sample by shooting it out of a cannon or hitting it with a laser beam For a given initial state the final state is solely a function of the impact energy Decompression is fast (~5 ns) nearly elastic Low entropy (< Scrit) experiments record T <= Tboil, high entropy experiments
Hydrocode EoS ANEOS – Mie Gruneisen model (Thompson 1973) A = Acold + Athermal Acold => Pcold = C(f^m – f^n), f = rho/rho0 => Zharkob & Kalinin 1971 Athermal = Debye Model + f(Y(rho,T)) => Korner et al 1962 Y = 0 => solid Y=1 gas Parameterized by fitting the theoretical energy for a monatomic gas in the infinite T limit Underestimates the extent of vaporization because in most cases much less energy is required to vaporize a solid to diatomic or more complex molecules
So What’s the Deal The ionic liquid model and the molecular gas model, both of which are supported by experimental evidence, must converge at the critical point Modeling the ionic limit would require introducing new gas phase species for the gas phase, there is no experimental evidence for such species, ergo the simplest limit is the molecular limit, i.e., to assume that the melt becomes increasingly molecular along the boiling curve In this case, we have 5 species possible in both phases and the speciation in