Download
1 / 4
40 likes | 241 Vues
Flowchart of participants. Beatrice A. Golomb, et al. Arch Intern Med. 2008;168:721-727. Randomized Substudy Groups Compared at Baseline. Beatrice A. Golomb, et al. Arch Intern Med. 2008;168:721-727. BP Difference, Statin Groups vs Placebo.

E N D
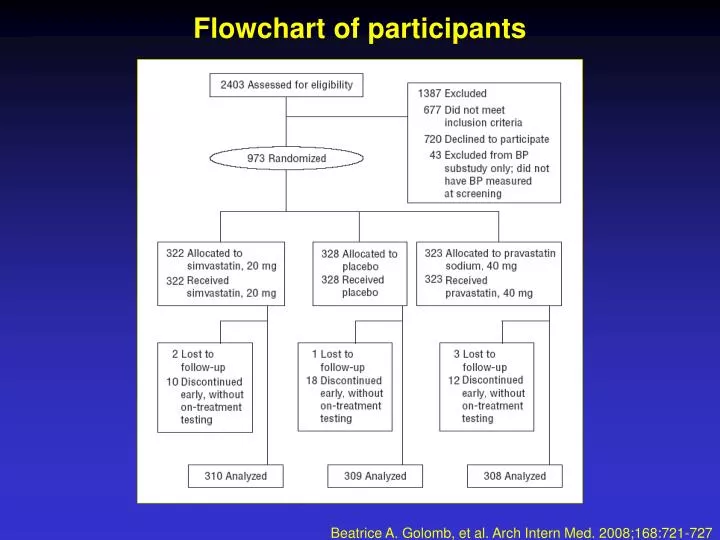
Flowchart of participants Beatrice A. Golomb, et al. Arch Intern Med. 2008;168:721-727
Randomized Substudy Groups Compared at Baseline Beatrice A. Golomb, et al. Arch Intern Med. 2008;168:721-727
BP Difference, Statin Groups vs Placebo Beatrice A. Golomb, et al. Arch Intern Med. 2008;168:721-727
Difference between the statin and placebo groups A, Systolic blood pressure (SBP), change from baseline. This figure shows values for subjects who were not hypertensive at baseline, were never prescribed BP medications, and had BP measured through the 8-month visit. This mitigates the influence of changes distinct from treatment assignment across time. The change values differed significantly from placebo (P<.05) at month 6 (only) for both pravastatin sodium and simvastatin. Standard errors for pravastatin: month 1, 1.3; month 6, 1.2; month 8, 1.2. Standard errors for simvastatin: month 1, 1.2; month 6, 1.2; month 8, 1.2. P values for pravastatin: month 1, P =.18; month 6, P =.04; month 8, P =.69. P values for simvastatin: month 1, P =.30; month 6, P =.02; month 8, P =.18. B, DBP, change from baseline. This figure shows values for subjects who were not hypertensive at baseline, were never prescribed BP medications, and had BP measured through the 8-month visit. This mitigates the influence of changes distinct from treatment assignment across time. The change values differed significantly from placebo (P<.01) at month 6 (only) for both pravastatin and simvastatin. Standard errors for pravastatin: month 1, 0.98; month 6, 0.96; month 8, 1.0. Standard errors for simvastatin: month 1, 0.97; month 6, 0.98; month 8, 1.0. P values for pravastatin: month 1, P =.06; month 6, P =.004; month 8, P =.06. P values for simvastatin: month 1, P =.46; month 6, P =.01; month 8, P =.66. B.A. Golomb, et al. Arch Intern Med 2008;168:721-727