Download
1 / 36
380 likes | 410 Vues
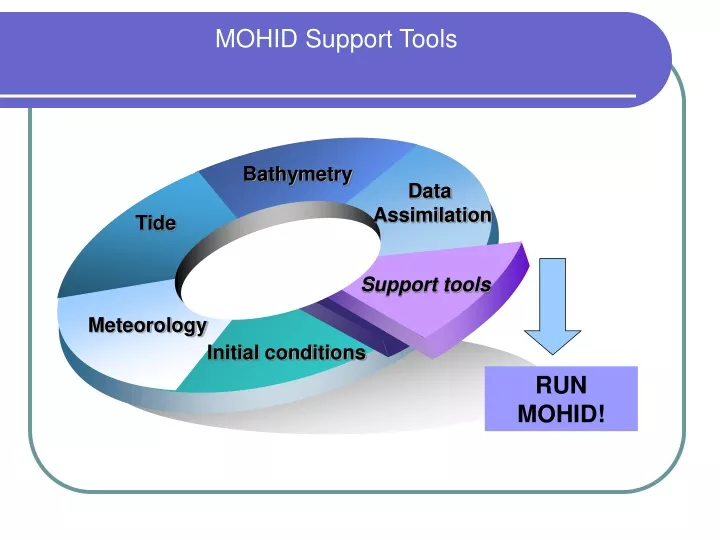
Bathymetry. Data Assimilation. Tide. Support tools. Meteorology. Initial conditions. MOHID Support Tools. RUN MOHID!. MOHID Support Tools. How does MOHID reads data? Standard file formats Standard Input Data Interface: ModuleFillMatrix

E N D
Bathymetry Data Assimilation Tide Support tools Meteorology Initial conditions MOHID Support Tools RUN MOHID!
MOHID Support Tools • How does MOHID reads data? • Standard file formats • Standard Input Data Interface: ModuleFillMatrix • Reads information to initialize/modify 2D and 3D arrays • Most arrays in MOHID are covered by the FillMatrix feature • Reduces errors related with input data
MOHID Support Tools • MOHID MARKUP LANGUAGE (Braunschweig et al, 2004a,b)
MOHID Support Tools • Standard file formats used by Mohid • XYZ, Polygon, Lines, Grid Data, Grid, Field Data, Drainage Network, River Cross Section, Background Image • HDF5 • Time Series • Boxes • Profile • Profile Time Series
MOHID Support Tools – ModuleFillMatrix • GRIDDATA FORMAT • 2D (e.g. water level), 3D (e.g. salinity) • Blocks <BeginGridData3D>…<EndGridData3D> • Different configurations • 1 column: just with values (number of values = I x J x K) • 3 columns*: index I, index J and value • 4 columns*: index I, index J, index K and value • *not mandatory to fill all cells. Cells not included in the list are given the DEFAULTVALUE
MOHID Support Tools – ModuleFillMatrix • FILLMATRIX KEYWORDS • FILE_IN_TIME • NONE, HDF, TIMESERIE, PROFILE_TIMESERIE • REMAIN_CONSTANT • 0 or 1 • INITIALIZATION_METHOD • ANALYTIC PROFILE, ASCII_FILE, BOXES, CONSTANT, HDF, LAYERS, PROFILE, PROFILE_TIMESERIE, TIMESERIE • DEFAULTVALUE • Mandatory to specify a default value
Bathymetry Data Assimilation Tide Support tools Meteorology Initial conditions MOHID Support Tools - Bathymetry • Generate Grid • Convert base information • Create bathymetry • Filter bathymetry
MOHID Support Tools • Generate Grid • Input data file = GridGenerator.dat • Regular grids(equidistant or non-equidistant)
MOHID Support Tools • Convert to XYZ • Input data file = ConvertToXYZ.dat • XYZ - GEBCO, ETOPO2, ETOPO5, NASA • Lines - NOAA Shore lines • <begin_window> • MAXIMUM : 1 • MINIMUM : -9999 • TOP : 41.83 • BOTTOM : 37.15 • LEFT : -11.5 • RIGHT : -8.57 • [SPECIFIC KEYWORDS FOR EACH MODULE] • <end_window>
MOHID Support Tools • Digital Terrain Creator • Input data file = CreateBathymetry.dat • Runs partially from MOHID GIS
Digital Terrain Tool – GUI version • Etopo 2
Digital Terrain Tool – Version uggly SMOOTH : 0 RADIUS : 1000 BATIM_FILE : D:\Aplica\Proj_262\Batim\TagusEstuaryCurvilinear\GridData\CarregadoBathym.dat GRID_FILE : D:\Aplica\Proj_262\Batim\TagusEstuaryCurvilinear\Grid\CarregadoV3.grd INTERPOLATION : Triangulation FILL_OUTSIDE_POINTS : 1 POINTS_FOR_INTERPOLATION: 3 EXPAND_GRID_LIMITS : 1 GRID_LIMITS_PERCENTAGE : 0.5 !CANONIC_SPACE : 1 !MAINTAIN_RIVER_BED : 1 !RIVER_CHANGE_FACTOR : 1. !RIVER_FLOW_DIRECTION : j <BeginLandAreaFiles> D:\Aplica\Proj_262\Batim\TagusEstuaryCurvilinear\xy\ME.xy D:\Aplica\Proj_262\Batim\TagusEstuaryCurvilinear\xy\MD.xy <EndLandAreaFiles> <BeginXYZPointsFiles> D:\Aplica\Proj_262\Batim\TagusEstuaryCurvilinear\xyz\seccoes_intermedias_v2.xyz D:\Aplica\Proj_262\Batim\TagusEstuaryCurvilinear\xyz\LevantamentoBrisa2003.xyz <EndXYZPointsFiles> OVERLAPPING : 0 OVERLAPPING_NUMBER : 1 <BeginGridDataInfo> LEVEL : 1 ! H_MAX : 2 ! GRIDATA_FILE : D:\Aplica\Proj_262\Batim\TagusEstuaryCurvilinear\GridData\CarregadoDragagem.dat PERCENTAGE : 1 <EndGridDataInfo>
Bathymetry Data Assimilation Tide Support tools Meteorology Initial conditions MOHID Support Tools - Tide • Generate harmonic components to impose at the boundary • Preview elevations from harmonics • Harmonic analysis
MOHID Support Tools • TidePrev • Input data file = TidePrevInput.dat • Generates a time series file • START : 2004 12 21 0 0 0 • END : 2004 12 23 0 0 0 • DT : 600 • <begintideprev> • NAME : K13Aplatform • IN_TIDES : TidalComponents.dat • OUT_FILE : K13Aplatform.prv • <endtideprev>
MOHID Support Tools • T_TIDE • Call from MATLAB environment. Uses file package (.m, .dat, tables) • Components: all astronomic, shallow-water • Input Function call (common) [estrBarraFaro,levelrecBarraFaro]=t_tide(levelBarraFaro, ‘interval’,1, 'starttime',datainic, 'latitude',latitude(1,3), 'output','TideCompBarraFaro.txt', 'synthesis',2); • Other options: 'prefilt‘, 'inference‘, 'shallow' data (column vector) hours (default = 1) reconstructed data (just tide) (yy,mm,dd,hh,mm,ss) 0 = use all components >0 = use components with SNR > specified (defaul = 2)
MOHID Support Tools • T_TIDE • Output component name component significative according with SNR>2
MOHID Support Tools • Fourfilt.m • Filter data for frequency • Call from MATLAB environment • Function call [filtdat]=fourfilt(data,delt,tmax,tmin) • Low pass filter: tmax > (length(data)*delt) (no cutoff low freq end) • High pass filter: tmin < (2*delt) (no cutoff high freq end) • Band pass filter: tmin and tmax = band limits minimum period filter cutoff Same time units maximum period filter cutoff filtered data (column vector) sampling interval data (column vector)
MOHID Support Tools • Tide FES95.2 (Le Provost, 1998) • Input data file = input.dat • Lon Lat X Y ReferenceLevel TimeReference • Output data files • TidalComponents.dat (ready to use with MOHID) • Output.xyz (points read from input data file) • NoInformation.xyz (points with no information) • WithInformation.xyz (points present in the TidalComponents.dat file)
Bathymetry Data Assimilation Tide Support tools Meteorology Initial conditions MOHID Support Tools - Meteorology • Convert files to HDF5 format • MM5, ARPS, ECMWF, Hellerman-Rosenstein • Interpolate data to simulation domain • Generate final meteorology file
MOHID Support Tools • ConvertToHDF5 – Meteorology files • Input data file = ConvertToHDF5Action.dat • Converts various formats to HDF5 • MM5 • ARPS • ARPS+GFS (from ASCII) • ECMWF (ASCII data for 1994 only) • Will include other formats such as NOAA Reanalysis Winds • Interpolates to Mohid grid (Bilinear, Spline2D, Triangulation)
MOHID Support Tools • ConvertToHDF5 – MM5
MOHID Support Tools • ConvertToHDF5 – GLUE HDF5 Files • Files must have same structure
MOHID Support Tools • Ventostplt1.m • Create stickplot of two vectors (U,V) • Call from MATLAB environment • Uses julian.m, timeplt.m, stacklbl.m • Function call Ventostplt1(startime,stoptime,vectorU,vectorV,dim,interval) • Labels: altered in m file or in window • Image: in window File Export data time interval (days) (yy,mm,dd,hh,mm,ss) column data vectors vector dimension
Bathymetry Data Assimilation Tide Support tools Meteorology Initial conditions MOHID Support Tools – Initial/Boundary Conditions • Convert files to HDF5 format • LEVITUS • Interpolate data to simulation domain • Generate initial condition file • Analyze initial condition file
Hydrodynamic Analyser • This tools aims to compute dynamic variables from velocity, temperature and salinity fields: • 3D Vorticity field; • 2D Kinetic energy field; • 2D Potential energy field; • 2D Baroclinic force field; • 3D Brunt-Vaisalla frequency field
Meridional Baroclinic Force – Monthly climatology With pressure correction Without pressure correction
HydrodynamicAnalyser.dat PRESSURE_CORRECT : 1 !DENSITY_METHOD : 1 GRID_FILENAME : D:\Aplica\Proj_230\Simula\GeneralData\Batim\SmoothSubBathym\IberianCoastLevitusGeoSmoothTransition.dat_.new GEOMETRY_FILENAME : D:\Aplica\Proj_230\Simula\AtlanticNE_LevitusGeometry\IberianCoast\data\Geometry_1.dat INITIAL_ANALYSIS : 0 !INI_TIME : 1994 12 31 12 0 0 BAROCLINIC_FORCE : 1 BAROCLINIC_METHOD : 4 !VORTICITY : 1 !KINETIC_ENERGY : 1 !RESIDUAL_HYDRO : 1 OUTPUT_FILENAME : IberiaCoastBaroclinicLeibniz2.hdf5 !HYDRODYNAMIC_FILENAME : D:\Aplica\Proj_230\Simula\AtlanticNE_LevitusGeometry\res\Hydrodynamic_5.hdf5 WATER_FILENAME : d:\aplica\Proj_230\Simula\GeneralData\AnalyseInitialCondition\IberianCoastAnnual.hdf5
Convert files to HDF5 formatLEVITUS • Step 1 : Read from ASCII to HDF5; • Step 2 : Extrapolate using triangulation or the nearest neighbor to all points; • Step 3 : Interpolate form Levitus grid to the model grid.
Step 1 <begin_file> ACTION : CONVERT LEVITUS FORMAT OUTPUTFILENAME : Levitus0.25.hdf5 OUTPUT_GRID_FILENAME : LevitusGrid.dat OUTPUT_GEOMETRY_FILENAME : LevitusGeometry.dat PERIODICITY : monthly SPATIAL_RESOLUTION : 0.25 FILL_VALUE : -99.9999 LOWER_LEFT_CORNER : -40 22 UPPER_RIGHT_CORNER : 11 66 <<beginfield>> NAME : temperature ANNUAL_FILE : K:\Proj_230\Dados\Levitus\t000hr.obj <<<begin_input_files>>> K:\Proj_230\Dados\Levitus\t001 K:\Proj_230\Dados\Levitus\t002 K:\Proj_230\Dados\Levitus\t003 K:\Proj_230\Dados\Levitus\t004 K:\Proj_230\Dados\Levitus\t005 K:\Proj_230\Dados\Levitus\t006 K:\Proj_230\Dados\Levitus\t007 K:\Proj_230\Dados\Levitus\t008 K:\Proj_230\Dados\Levitus\t009 K:\Proj_230\Dados\Levitus\t010 K:\Proj_230\Dados\Levitus\t011 K:\Proj_230\Dados\Levitus\t012 <<<end_input_files>>> <<endfield>> <<beginfield>> NAME : salinity ANNUAL_FILE : K:\Proj_230\Dados\Levitus\s000hr.obj <<<begin_input_files>>> K:\Proj_230\Dados\Levitus\s001 K:\Proj_230\Dados\Levitus\s002 K:\Proj_230\Dados\Levitus\s003 K:\Proj_230\Dados\Levitus\s004 K:\Proj_230\Dados\Levitus\s005 K:\Proj_230\Dados\Levitus\s006 K:\Proj_230\Dados\Levitus\s007 K:\Proj_230\Dados\Levitus\s008 K:\Proj_230\Dados\Levitus\s009 K:\Proj_230\Dados\Levitus\s010 K:\Proj_230\Dados\Levitus\s011 K:\Proj_230\Dados\Levitus\s012 <<<end_input_files>>> <<endfield>> <end_file>
Step 2 • <begin_file> • ACTION : INTERPOLATE GRIDS • TYPE_OF_INTERPOLATION : 1 • START : -9999 1 1 0 0 0 • END : -9999 12 1 0 0 0 • INTERPOLATION3D : 1 • FATHER_FILENAME : Levitus0.25.hdf5 • FATHER_GEOMETRY : LevitusGeometry.dat • FATHER_GRID_FILENAME : LevitusGrid.dat • NEW_GEOMETRY : LevitusGeometry.dat • OUTPUTFILENAME : LeviTusAllPointsWithData.hdf5 • NEW_GRID_FILENAME : LevitusGrid.dat • AUX_OUTPUTFILENAME : AuxLeviTusAllPointsWithData.hdf5 • AUX_GRID_FILENAME : LevitusGrid.dat • POLI_DEGREE : 3 • DO_NOT_BELIEVE_MAP : 1 • EXTRAPOLATE_2D : 2 • <end_file>
Step 3 • <begin_file> • ACTION : INTERPOLATE GRIDS • TYPE_OF_INTERPOLATION : 1 • START : -9999 1 1 0 0 0 • END : -9999 12 1 0 0 0 • INTERPOLATION3D : 1 • FATHER_FILENAME : LeviTusAllPointsWithData.hdf5 • FATHER_GEOMETRY : LevitusGeometry.dat • FATHER_GRID_FILENAME : LevitusGrid.dat • NEW_GEOMETRY : AtlanticNEGeometry.dat • OUTPUTFILENAME : AtlanticNE.hdf5 • NEW_GRID_FILENAME : AtlanticNEBathym.dat • AUX_OUTPUTFILENAME : AuxAtlanticNE.hdf5 • AUX_GRID_FILENAME : AtlanticNEBathym12km.dat • POLI_DEGREE : 3 • DO_NOT_BELIEVE_MAP : 1 • EXTRAPOLATE_2D : 0 • <end_file>
MOHID Support Tools • Assimilation Zones • Input data file = AssimilationZones.dat • Generates a GRIDDATA format file
MOHID Support Tools • Assimilation Zones
MOHID Support Tools • HDF5EXPORTER • Create time series from HDF5 files • Input file =nomfich.dat • IN_MODEL : LocaisMaregrafosNovoNivel.dat • ROOT_SRT : K:\Proj_ModOperEstTejo\Validation\ • Input data file HDF5 file block Eliminates meaningless statistics parameter block location block