Download
1 / 54
550 likes | 626 Vues
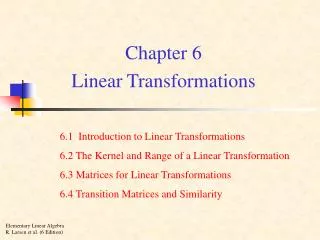
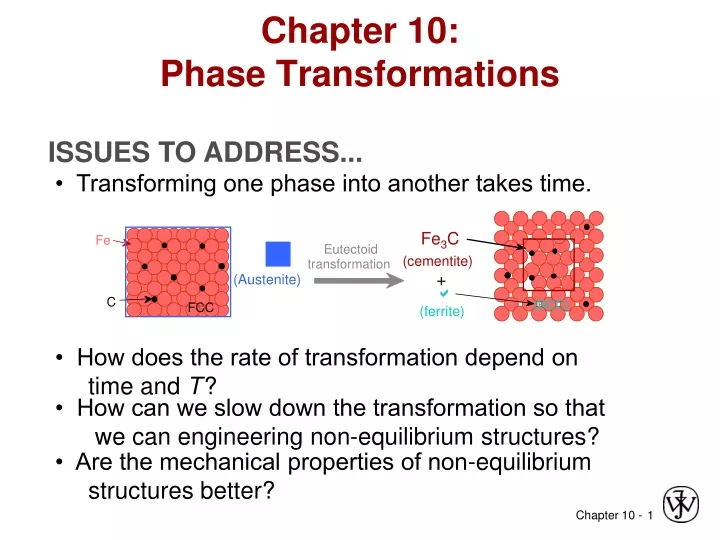
Chapter 10: Phase Transformations. Fe 3 C. Fe. g. Eutectoid. (cementite). transformation. +. (Austenite). a. C. (BCC). FCC. (ferrite). ISSUES TO ADDRESS. • Transforming one phase into another takes time. • How does the rate of transformation depend on time and T ?.

E N D
Chapter 10:Phase Transformations Fe3C Fe g Eutectoid (cementite) transformation + (Austenite) a C (BCC) FCC (ferrite) ISSUES TO ADDRESS... • Transforming one phase into another takes time. • How does the rate of transformation depend on time and T? • How can we slow down the transformation so that we can engineering non-equilibrium structures? • Are the mechanical properties of non-equilibrium structures better?
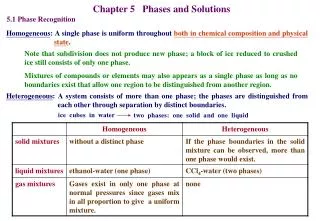
Phase transformations are divided into three classifications: simple diffusion-dependent transformations in which there is no change in either the number or composition of the phases present.( Ex. Solidification of a pure metal, allotropic transformations, recrystallization and grain growth) another type of diffusion-dependent transformation, there is some alteration in phase compositions and often in the number of phases present; the final microstructure ordinarily consists of two phases ( Ex. The eutectoid reaction) The third kind of transformation is diffusionless, wherein a metastable phase is produced.( Ex. martensitic transformation)
The progress of a phase transformation may be broken down into two distinct stages: nucleation: involve the appearance of very small particles, or nuclei of the new phase which are capable of growing. Favorable positions for the formation of these nuclei are imperfection sites, especially grain boundaries. growth : the nuclei increase in size; during this process, of course, some volume of the parent phase disappears. The transformation reaches completion if growth of these new phase particles is allowed to proceed until the equilibrium fraction is attained.
Phase Transformations Nucleation • nuclei (seeds) act as template to grow crystals • for nucleus to form rate of addition of atoms to nucleus must be faster than rate of loss • once nucleated, grow until reach equilibrium • Driving force to nucleate increases as we increase T • supercooling (eutectic, eutectoid) • superheating (peritectic) • Small supercooling few nuclei - large crystals • Large supercooling rapid nucleation - many nuclei, • small crystals
Solidification: Nucleation Processes • Homogeneous nucleation • nuclei form in the bulk of liquid metal • requires supercooling (typically 80-300°C max) • Heterogeneous nucleation • much easier since stable “nucleus” is already present • Could be wall of mold or impurities in the liquid phase • allows solidification with only 0.1-10ºC supercooling
Homogeneous nucleation • Related to Gibbs free energy G • Free energy is a function of other thermodynamics parameters: • internal energy of the system ( the enthalpy H) • a measurements of the randomness or disorder of the atoms • ( the entropy ) • Transformation will occur spontaneously only when ∆G has a • negative value
There are two contributions to the total free energy change that accompany a solidification transformation: • Free energy difference between the solid and liquid phases(or the volume free energy ∆Cv : negative if the T is below the equilibrium solidification temperature; • - the magnitude = ∆Gv x Volume of the spherical nucleus(4/3πr3 ) • The second energy results from the formation of the solid-liquid phase boundary during the solidification transformation( or the surface free energy γ) which is positive • - the magnitude = γ x The surface area of the nucleus(4πr2 ) • The total free energy change ∆G = 4/3πr3 ∆Gv + 4πr2 γ • A critical free energy ∆G* occurs at the critical radius and, consequently at the maximum of the curve. This ∆G* corresponds to an activation free energy, which is the free energy required for the formation of a stable nucleus. Equivalent, it may be considered an energy barrier to the nucleation process.
Surface Free Energy-destabilizes the nuclei (it takes energy to make an interface) g = surface tension DGT = Total Free Energy = DGS + DGV Volume (Bulk) Free Energy – stabilizes the nuclei (releases energy) Homogeneous Nucleation & Energy Effects r* = critical radius of nucleus: nuclei < r* shrink; nuclei>r* grow (to reduce energy)
Since r* and ∆G* appear at the maximum on the free energy-versus-radius curve, we can find r* and ∆G* by derivation equ. This volume free energy change ∆Gv is the driving force for the solidification transformation, and its magnitude is a function of temperature Tm, the value of ∆Gv is zero, and with diminishing temperature its value becomes increasingly more negative.
r* = critical radius g = surface free energy Tm = melting temperature HS = latent heat of solidification DT = Tm - T = supercooling • r * decreases asT increases • ∆G* decreases asT increases For typicalTr* ca. 100Å Solidification • Note:HS = strong function of T =weak function ofT
There are two important parameters ( temperature-dependent) influence nucleation: The number of stable nuclei n* ( having radii greater than r* ) the clustering of atoms by short – range diffusion during the formation of nuclei Qd – activation energy for diffusion ( temp. independent) K2 temp.independent constant
Nucleation rate - it has units of nuclei per unit volume per second Nucleation rate expression for homogeneous nucleation K3 – the number of atoms on a nucleus surface • Comments: • This method may be applied to any shape with the same final result • May be utilized for types of transformations other than solidification • ( ex. Solid-vapor, solid-solid) • For solid – solid transformation, there may be volume changes attendant to the formation of new phases, consequently will affect the magnitudes of r* and ∆G*
Tm νd N temperature n* Supercooling (undercooling): when during the cooling of liquid an appreciable nucleation rate ( i.e., solidification) will begin only after the temperature has been lowered to below the equilibrium solidification ( or melting) temperature Tm . The degree of supercooling may be significant. Superheating: Heating to above a phase transition temperature without the occurrence of the transformation.
Heterogeneous nucleation It is a nucleation which occurs at surfaces and interfaces( which is easier than other sites, because of the activation energy ( energy barrier) for nucleation is lowered when nuclei form on preexisting surfaces or interfaces, since the surface free energy is reduced. liquid θ solid S(θ) is a function only of θ ( the shape of nucleus), which will have a numerical value between zero and unity.
r* ∆G 0 r Heterogeneous nucleation occurs more readily
Tm temperature Nhet Nhom Nucleation rate
Growth • The growth step in a phase transformation begins once an embryo has exceeded the critical size, r* and becomes a stable nucleus. The nuclei increase in size; during this process, of course, some volume of the parent phase disappears. The transformation reaches completion if growth of these new phase particles is allowed to proceed until the equilibrium fraction is attained • The growth rate G is determined by the rate of diffusion, and its temperature dependence is the same for the diffusion coefficient
Overall transformation rate Tm Growth rate, G temperature Overall transformation rate Nucleation rate, N Rate • Overall transformation rate is equal to some product of N and G. • the size of product phase is particles will depend on transformation temperature.
How is conversion measured? X-ray diffraction – have to do many samples • electrical conductivity – follow one sample • sound waves – one sample Rate of Phase Transformations • Kinetics - measure approach to equilibrium vs. time • Hold temperature constant & measure conversion vs. time
All out of material - done maximum rate reached – now amount unconverted decreases so rate slows rate increases as surface area increases & nuclei grow By convention r = 1 / t0.5 Rate of Phase Transformation Avrami rate equation => y = 1- exp (-kt n) • k & n fit for specific sample(time independent constant Fixed T Fraction transformed, y 0.5 t0.5 log t Logarithm of heating time, t fraction transformed time The rate of transformation r is taken as the reciprocal of time required to Proceed halfway completation
135C 119C 113C 102C 88C 43C 1 10 102 104 Rate of Phase Transformations • In general, rate increases as T r = 1/t0.5 = A e -Q/RT • R = gas constant • T = temperature (K) • A = preexponential factor • Q = activation energy Arrhenius expression • r often small: equilibrium not possible!
• Growth of pearlite from austenite: Diffusive flow of C needed Austenite (g) cementite (Fe3C) grain a Ferrite (a) a a boundary g g a g g a pearlite a a growth a direction a • Recrystallization rate increases with DT. 100 600°C (DT larger) 650°C 50 y (% pearlite) 675°C (DT smaller) 0 Eutectoid Transformation Rate Course pearlite formed at higher T - softer Fine pearlite formed at low T - harder
Nucleation and Growth 100 Nucleation rate increases with T % Pearlite Growth Growth rate increases with T regime 50 Nucleation regime t log(time) 0.5 0 pearlite colony g g g T just below TE T moderately below TE T way below TE Nucleation rate low . Nucleation rate med Nucleation rate high Growth rate high Growth rate med. Growth rate low • Reaction rate is a result of nucleation and growth of crystals. • Examples:
T(°C) 1600 d L 1400 g +L g 1200 L+Fe3C 1148°C (austenite) 1000 g +Fe3C a Eutectoid: Fe3C (cementite) ferrite Equil. Cooling: Ttransf. = 727ºC 800 727°C DT a +Fe3C 600 Undercooling by DTtransf. < 727C 0.022 0.76 400 0 1 2 3 4 5 6 6.7 Co, wt%C (Fe) Transformations & Undercooling • Eutectoid transf. (Fe-C System): g Þ a + Fe3C • Can make it occur at: 0.76 wt% C 6.7 wt% C 0.022 wt% C ...727ºC (cool it slowly) ...below 727ºC (“undercool” it!)
Pearlite • Bainite • Spheroidite • Martensite Microstructure and property changes in Iron – Carbon Alloys
Isothermal Transformation Diagrams Consider again the iron–iron carbide eutectoid reaction which is fundamental to the development of microstructure in steel alloys. Upon cooling, austenite, having an intermediate carbon concentration, transforms to a ferrite phase, having a much lower carbon content, and also cementite, with a much higher carbon concentration. Pearlite is one microstructural product of this transformation • Temperature and time play an important role in the rate of the • austenite-to- pearlite transformation
Isothermal Transformation Diagrams T(°C) Austenite (stable) TE(727C) 700 Austenite (unstable) Pearlite 600 isothermal transformation at 675°C 500 100% 50% 0%pearlite 400 time (s) 2 3 4 5 1 10 10 10 10 10 • Fe-C system, Co = 0.76 wt% C • Transformation at T = 675°C. 100 T = 675°C Transformation end y, % transformed 50 Transformation beginning 0 2 4 time (s) 1 10 10
Several constraints are imposed on using diagrams like Figure before: • This particular plot is valid only for an iron–carbon alloy of eutectoid composition; for other compositions, the curves will have different configurations • These plots are accurate only for transformations in which the temperature of the alloy is held constant throughout the duration of the reaction such as Figure are referred to as isothermal transformation diagrams, or sometimes as time–temperature–transformation (or T–T–T) plots.
Effect of Cooling History in Fe-C System 2 3 4 5 1 10 10 10 10 10 T(°C) Austenite (stable) TE (727C) 700 Austenite (unstable) Pearlite 600 g g g g g g 100% 500 50% 0%pearlite 400 time (s) • Eutectoid composition, Co = 0.76 wt% C • Begin at T > 727°C • Rapidly cool to 625°C and hold isothermally. A C D B 625 An actual isothermal heat treatment curve (ABCD) on the TTT diagram
Coarse pearlite: This microstructure has relatively thick layers of both the -ferrite and Fe3C –phases at temperatures just below the eutectoid Fine pearlite: The thin-layered structure produced in the vicinity of 540C because of decreasing temperature, and so the decrease of carbon diffusion rate
CO = 1.13 wt% C T(°C) T(°C) 900 1600 d A L 1400 800 TE (727°C) A g +L + g 1200 L+Fe3C A C (austenite) 700 P 1000 + Fe3C (cementite) g +Fe3C a P A 600 800 DT a +Fe3C 500 600 0.022 0.76 1 10 102 103 104 1.13 400 727°C time (s) 0 1 2 3 4 5 6 6.7 (Fe) Co, wt%C Transformations with Proeutectoid Materials Hypereutectoid composition – proeutectoid cementite
800 Austenite (stable) TE T(°C) A P 600 100% pearlite pearlite/bainite boundary 100% bainite B 400 A 200 0% 100% 50% 10 -1 3 5 10 10 10 time (s) Non-Equilibrium Transformation Products: Fe-C • Bainite: --a lathes (strips) with long rods of Fe3C --diffusion controlled. • Isothermal Transf. Diagram Fe3C (cementite) a (ferrite) 5 mm It occurs at temperatures below those at which pearlite forms; begin-, end-, and half-reaction curves are just extensions of those for the pearlitic transformation Pearlite forms above the nose—that is, over the temperature range of about 540 to 727. At temperatures between about 215 and 540C Bainite is the transformation product.
Spheroidite: Fe-C System a (ferrite) Fe3C (cementite) 60 m • Spheroidite is formed when a steel alloy having either pearlitic or bainitic microstructures is heated to, and left at, a temperature below the eutectoid for a sufficiently long period of time—for example, at about 700C (1300F) for between 18 and 24 h • The Fe3C phase appears as spherelike • particles embedded in a continuous α • phase matrix. • Spheroidite: --a grains with spherical Fe3C --diffusion dependent. --heat bainite or pearlite for long times --reduces interfacial area (driving force)
Martensite: Fe-C System (involves single atom jumps) x Fe atom potential 60 m x x sites C atom sites x x x Martensite needles 800 Austenite (stable) Austenite TE T(°C) A P 600 B 400 A 100% 50% 0% 0% 200 M + A 50% M + A 90% M + A time (s) -1 10 3 5 10 10 10 • Martensite: --g(FCC) to Martensite (BCT) (Adapted from Fig. 10.20, Callister, 7e. • Isothermal Transf. Diagram • g to M transformation.. -- is rapid!(quenching process) -- % transf. depends on T only -- time independent
quench tempering M (BCT) Martensite Formation Is formed when austenitized iron–carbon alloys are rapidly cooled (or quenched) to a relatively low temperature (in the vicinity of the ambient) (FCC) (BCC)+ Fe3C slow cooling • M = martensite is body centered tetragonal (BCT) • Diffusionless transformation BCT if C > 0.15 wt% • BCT few slip planes hard, brittle Martensite is a nonequilibrium single-phase structure that results from a diffusionless transformation of austenite(rapid cooling prevent carbon diffusion).
Phase Transformations of Alloys Effect of adding other elements • Change transition temp. • changes in the positions and shapes of the curves in the isothermal transformation diagrams. Cr, Ni, Mo, Si, Mn retard + Fe3C transformation
CONTINUOUS COOLING TRANSFORMATION DIAGRAMS • An isothermal transformation diagram is valid only for conditions of constant temperature, which diagram must be modified for transformations that occur as the temperature is constantly • changing. For continuous cooling, the time required for a reaction to begin and end is delayed.A plot containing such modified beginning and ending reaction curves is termed a continuous cooling transformation (CCT) diagram.
Cooling Curve plot temp vs. time
Dynamic Phase Transformations On the isothermal transformation diagram for 0.45 wt% C Fe-C alloy, sketch and label the time-temperature paths to produce the following microstructures: • 42% proeutectoid ferrite and 58% coarse pearlite • 50% fine pearlite and 50% bainite • 100% martensite • 50% martensite and 50% austenite
800 A + a A A + P P 600 B A + B A 50% 400 M (start) M (50%) M (90%) 200 0 0.1 10 103 105 time (s) Example Problem for Co = 0.45 wt% • 42% proeutectoid ferrite and 58% coarse pearlite first make ferrite then pearlite coarse pearlite higher T T (°C)
800 A + a A A + P P 600 B A + B A 50% 400 M (start) M (50%) M (90%) 200 0 0.1 10 103 105 time (s) Example Problem for Co = 0.45 wt% • 50% fine pearlite and 50% bainite first make pearlite then bainite fine pearlite lower T T (°C)
800 A + a A A + P P 600 B A + B A 50% 400 M (start) M (50%) d) M (90%) 200 c) 0 0.1 10 103 105 time (s) Example Problem for Co = 0.45 wt% • 100 % martensite – quench = rapid cool • 50 % martensite • and 50 % austenite T (°C)
Mechanical Prop: Fe-C System • Pearlite: • --Cementite is much harder but more brittle than ferrite • -- increasing the fraction of Fe3C in a steel alloy while • holding other microstructural elements constant will • result in a harder and stronger material • -- Fine pearlite is harder and stronger than coarse pearlit • because of different in the layer thickness of each of • the ferrite and cementite phases • -- Coarse pearlite is more ductile than fine pearlite, • because of the greater restriction to plastic • deformation of the fine pearlite
Spheroidite: • -- Alloys containing pearlitic microstructures have greater strength and hardness than do those with spheroidite. This behavior is explained in terms of reinforcement at, and impedance to, dislocation motion across the ferrite–cementite boundaries as discussed above. There is less boundary area per unit volume in spheroidite, and consequently plastic deformation is not nearly as constrained, which gives rise to a relatively soft and weak material. In fact, of all steel alloys, those that are softest and weakest have a spheroidite microstructure • -- spheroidized steels are extremely ductile, much more than either fine or coarse pearlite .In addition, they are notably tough because any crack can encounter only a very small fraction of the brittle cementite particles as it propagates through the ductile ferrite matrix.
Bainite: • -- Because bainitic steels have a finer structure (i.e., smaller -ferrite and Fe3C particles), they are generally stronger and harder than pearlitic ones; yet they exhibit a desirable combination of strength and ductility. • Martinsite: • -- Martensite is the hardest and strongest and, the most brittle; it has, in fact, negligible ductility. Its hardness is dependent on the carbon content, up to about 0.6 wt%. these properties are attributed to the effectiveness of the interstitial carbon • atoms in hindering dislocation motion (as a solid-solution effect) and to the relatively few slip systems (along which dislocations move) for the BCT structure.
Mechanical Prop: Fe-C System (1) Pearlite (med) • Effect of wt% C (hard) ementite C Pearlite (med) ferrite (soft) Co< 0.76 wt% C Co > 0.76 wt% C Hypoeutectoid Hypereutectoid
Hypo Hyper Hypo Hyper TS(MPa) %EL 80 1100 YS(MPa) 100 900 hardness 40 700 Impact energy (Izod, ft-lb) 50 500 0 300 0 1 0.5 0 1 0.5 0 0.76 wt% C 0.76 wt% C • More wt% C(or equivalent Fe3C): TS and YS increase , %EL decreases.
Hypo Hyper Hypo Hyper 90 320 fine spheroidite 60 pearlite 240 coarse Ductility (%AR) pearlite spheroidite Brinell hardness coarse 160 30 pearlite fine pearlite 80 0 1 1 0.5 0 0.5 0 wt%C wt%C Mechanical Prop: Fe-C System (2) • Fine vs coarse pearlite vs spheroidite fine > coarse > spheroidite • Hardness: fine < coarse < spheroidite • %RA: