Download
1 / 10
190 likes | 1.84k Vues
Topic 9 - Statistical Analysis 2 - T-test & Z-test Deal with only one metric question Test the hypothesis about the mean Whether to use T-test or Z-test? Depend on the sample size If n>30, use Z-test If n<30, use T-test Determine whether the test is one-tailed or two-tailed

E N D
Topic 9 - Statistical Analysis 2 -
T-test & Z-test • Deal with only one metric question • Test the hypothesis about the mean • Whether to use T-test or Z-test? • Depend on the sample size • If n>30, use Z-test • If n<30, use T-test • Determine whether the test is one-tailed or two-tailed
Formula for T-test & Z-test Z-test T-test where • Xbar = mean of the sample • μ = mean of the population (value in H0) • = standard error of the mean d.f. = n-1
Example 1 (T-test & Z-test) • EPA (Environmental Protection Agency) evaluated the mileage claims of Ford automobiles by obtaining a random sample of 100 Ford cars to make sure that the mileage is greater than 30 miles per gallon (mpg). If mileage is greater than 30 mpg, EPA has the authority to give tax exemptions to Ford. The sample mean mpg achieved was 33.6, and the standard error was 1.2 mpg. What should EPA do? (give tax exemptions or not)
Example 2 (T-test & Z-test) • In a test marketing study, the average sales for a new brand of shampoo in 10 stores is 2020 bottles, standard error is 20. The retail management is expecting to sell at least an average of 2000 units for the product to be considered successful and therefore launch it at national level. Is the product successful according to management’s expectation?
Example 3 (T-test & Z-test) • A manufacturer of automobile windshield has to produce windshields that can obtain a quality rating of 5,000 points. Based on past experience, the manufacturer knows that the standard error of quality rating is 25. To check the quality, the management picks a random sample of 100 windshields and finds that the mean quality rating is 4,960. Based on this sample, the management wants to know whether its products meets the quality standard and is neither higher nor lower.
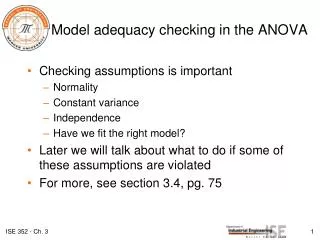
ANOVA • ANalysis Of VAriance (ANOVA) • Deal with only two questions • One non-metric • One metric • Test of means for two or more groups • One-tailed test
ANOVA • Null hypothesis (H0): no difference between means of all groups • Alternative hypothesis (H1): at least there is one mean different from others
Example 1 (ANOVA) • Suppose your household were to select a telephone calling card. Please rate the importance of “easy to use” this attribute. (5 is denoted as “very important, and 1 is denoted as “very unimportant”.) From the data, can we say that there is no difference on the importance of “easy to use” between groups?
Example 2 (ANOVA) • Please indicate your opinion as to the extent to which you agree or disagree with the statement “The prices are reasonable” for Publix.(7 is denoted as “strongly agree, and 1 is denoted as “strongly disagree”.) From the data, can we say that there is no difference on the agreement between groups for this statement?