Download
1 / 21
210 likes | 999 Vues
USDA SERVICE CENTER AGENCIES Geographic Information System (GIS) OVERVIEW

E N D
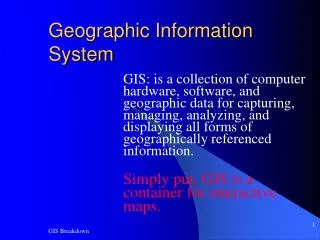
USDA SERVICE CENTER AGENCIES Geographic Information System (GIS) OVERVIEW “No other technology integrates, synthesizes, and displays complex agricultural information and relationships as completely or intuitively as GIS. GIS brings together people, data, and technology to support better decision making.” GIS Strategy Document Dec. 2001
Enlarged and Scaled Aerial Photography has been used for many years to record and measure farm information.
GIS Technologies Will Replace Manually Intensive Processes Manual Method GIS - Faster, Better, Cheaper
Field Measurements Can be Made By GPS Instead of Wheel Measurements using Wheel GPS - Faster, Better, Cheaper
USDA Geospatial Data Themes Common Land Unit Soils Demographics Orthoimagery • FSA Focus for Other Themes: • CLU Based Themes • Land Use/ Land Cover • Owner/Operator Links • Easements • CRP • HEL • Wet Lands Point Data • Digital Photography • Satellite Imagery • Public Land Survey • Daily Weather Data • Lower Priority Themes: • Digital Raster Graphics • Geographic Names • Government Units • Elevation • Watershed Boundaries • Transportation
Scans D.E.M. Control Ortho How Digital Ortho Images Are Created: Digital Ortho Imagery are created by taking scanned images (I.E. NAPP Film), incorporating control points derived from GPS or from land survey, and draping the imagery over a Digital Elevation Model (DEM). The software then projects the control points, DEM, and imagery and creates a DigitalOrtho Photograph.
X: Latitude Y: Longitude Z: Elevation DEM’s -Digital Elevation Models Digital Elevation Models or DEM’s are raster data that represent the terrain or slope of a given area in a mathematical model. DEM’s are registered to the ground through a geographic projection. DEM’s have three coordinate readings; X, Y, Z.
DOQQ (USGS Digital Ortho Quarter Quad) • 3.75’ x 3.75’Minute Format • 1 Meter Resolution
16 DOQQ’s Seamed Together = MDOQ 12 Secondary 4 Primary
MDOQ Tile (Mosaicked Digital Ortho Quad) • 7.5’ x 7.5’ Minute Format • 1 Meter Resolution
Seam Lines Between DOQQ’s • Interactively Placed • Within Overedge Of • Adjacent DOQQs
Typical Problem Encountered When Mosaicking... Interactively placed Seam Lines Avoid Areas Of Offset Due to differences in source photography and DOQQ production factors, the USGS DOQQ’s can have up to 10 meters (31 feet) of displacement on the X and Y coordinates. The mosaic cut line is interactively placed in areas where differences are minimal, and offset is reduced or eliminated.
Example Of Checker board Mosaic Tone Adjustment Radiometric (tone) Adjustment is a process where all image tiles for a given area (I.E. county) are gathered, and a universal tone is assigned throughout the area. This reduces the “checker board” type mosaic effect as can be seen in the example.
Image Compression Process: Image mosaics are compressed with the following compression ratios: Black and White: 20 to 1 CIR: 50 to 1
County Index: Full View Zoom In Of Features Image Plot Index
Common Land Unit (CLU) Tabular Data • Tract Number(s) • Field Number(s) • Acreage Total(s) • Land Classification
Building the GIS Database CLU Attributes FSA Farm Records Farm: 202 Tract: 1101 CLU: 2 Operator: J. Jones Owner: J. Jones 2000 Land Cover: Ag 2000 Landuse: Corn 2000 Use Status: Planted 2000 Planting Date: 3/10/2000 2000 Reported Acres: 150 1999 Land Cover: Ag 1999 Landuse: Soybeans 1999 Use Status: Harvested 1999 Planting Date: 3/20/1999 1999 Reported Acres: 150 HEL/NHEL: HEL Service Center FSA Field Boundaries Digital Ortho-Image Base
Blue Fills Are Random Selections QA Inspection Steps Of The Common Land Unit (CLU) Randomly Select Fields To Inspect. Field Boundaries Are Randomly Selected To Ensure That Enough Inspections Are Completed To Discover Any Inaccurate Trends With A 90 Percent Confidence Level. Green Fills Are Checked And Accepted


![Geographic Information System [GIS]](https://cdn2.slideserve.com/5315378/geographic-information-system-gis-dt.jpg)