Download
1 / 62
721 likes | 1.46k Vues
Water Treatment Processes. ENVR 890 Mark D. Sobsey Spring, 2007. Water Sources and Water Treatment. Drinking water should be essentially free of disease-causing microbes, but often this is not the case.

E N D
Water Treatment Processes ENVR 890 Mark D. Sobsey Spring, 2007
Water Sources and Water Treatment • Drinking water should be essentially free of disease-causing microbes, but often this is not the case. • A large proportion of the world’s population drinks microbially contaminated water, especially in developing countries • Using the best possible source of water for potable water supply and protecting it from microbial and chemical contamination is the goal • In many places an adequate supply of pristine water or water that can be protected from contamination is not available • The burden of providing microbially safe drinking water supplies from contaminated natural waters rests upon water treatment processes • The efficiency of removal or inactivation of enteric microbes and other pathogenic microbes in specific water treatment processes has been determined for some microbes but not others. • The ability of water treatment processes and systems to reduce waterborne disease has been determined in epidemiological studies
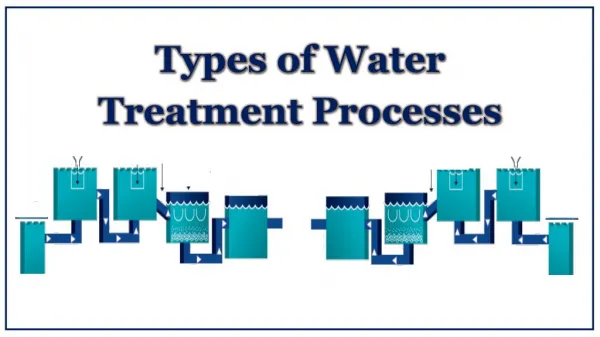
Summary of Mainline Water Treatment Processes • Storage • Disinfection • Physical: UV radiation, heat, membrane filters • Chemical: Chlorine, ozone, chlorine dioxide, iodine, other antimicrobial chemicals • Filtration • Rapid granular media • Slow sand and other biological filters • Membrane filters: micro-, ultra-, nano- and reverse osmosis • Other physical-chemical removal processes • Chemical coagulation, precipitation and complexation • Adsorption: e.g., activated carbon, bone char, etc, • Ion exchange: synthetic ion exchange resins, zeolites, etc.
Water Treatment Processes: Storage Reservoirs, aquifers & other systems: • store water • protect it from contamination • Factors influencing microbe reductions (site-specific) • detention time • temperature • microbial activity • water quality: particulates, dissolved solids, salinity • sunlight • sedimentation • land use • precipitation • runoff or infiltration
Water Storage and Microbial Reductions • Microbe levels reduced over time by natural antimicrobial processes and microbial death/die-off • Human enteric viruses in surface water reduced 400-1,000-fold when stored 6‑7 months (The Netherlands) • Indicator bacteria reductions were less extensive, probably due to recontamination by waterfowl. • Protozoan cyst reductions (log10) by storage were 1.6 for Cryptosporidium and 1.9 for Giardia after about 5 months (The Netherlands; G.J Medema, Ph.D. diss.) • Recent ICR data indicates lower protozoan levels in reservoir or lake sources than in river sources; suggests declines in Giardia & Cryptosporidium by storage
Chemical Coagulation-Flocculation Removes suspended particulate and colloidal substances from water, including microorganisms. Coagulation: colloidal destabilization • Typically, add alum (aluminum sulfate) or ferric chloride or sulfate to the water with rapid mixing and controlled pH conditions • Insoluble aluminum or ferric hydroxide and aluminum or iron hydroxo complexes form • These complexes entrap and adsorb suspended particulate and colloidal material.
Coagulation-Flocculation, Continued Flocculation: • Slow mixing (flocculation) that provides for for a period of time to promote the aggregation and growth of the insoluble particles (flocs). • The particles collide, stick together abd grow larger • The resulting large floc particles are subsequently removed by gravity sedimentation (or direct filtration) • Smaller floc particles are too small to settle and are removed by filtration
Microbe Reductions by Chemical Coagulation-Flocculation • Considerable reductions of enteric microbe concentrations. • Reductions In laboratory and pilot scale field studies: • >99 percent using alum or ferric salts as coagulants • Some studies report much lower removal efficiencies (<90%) • Conflicting information may be related to process control • coagulant concentration, pH and mixing speed during flocculation. • Expected microbe reductions bof 90-99%, if critical process variables are adequately controlled • No microbe inactivation by alum or iron coagulation • Infectious microbes remain in the chemical floc • The floc removed by settling and/or filtration must be properly managed to prevent pathogen exposure. • Recycling back through the plant is undesirable • Filter backwash must be disinfected/disposed of properly.
Cryptosporidium Removals by Coagulation (Jar Test Studies) Coagulant Dose (mg/L) Oocyst Removal, % (log10) Alum 5 99.8 (2.7) 1 87 (0.9) 99.5 (2.3) 97 (1.5) Iron 6 5
Water Softening and Microbe Reductions • ”Hard" Water: contains excessive amounts of calcium and magnesium ions • iron and manganese can also contribute to hardness. • Hardness ions are removed by adding lime (CaO) and sometimes soda ash (Na2CO3) to precipitate them as carbonates, hydroxides and oxides. • This process, called softening, is basically a type of coagulation‑flocculation process. • Microbe reductions similar to alum and iron coagulation when pH is <10 • Microbe reductions >99.99% possible when pH is >11 • microbial inactivation + physical removal
Microbial Reductions by Softening Treatment • Softening with lime only (straight lime softening); moderate high pH • ineffective enteric microbe reductions: about 75%. • Lime‑soda ash softening • results in the removal of magnesium as well as calcium hardness at higher pH levels (pH >11) • enteric microbe reductions >99%. • Lime‑soda ash softening at pH 10.4, 10.8 and 11.2 has produced virus reductions of 99.6, 99.9 and 99.993 percent, respectively. • At lower pH levels (pH <11), microbe removal is mainly a physical process • infectious microbes accumulate in the floc particles and the resulting chemical sludge. • At pH levels above 11, enteric microbes are physically removed and infectivity is also destroyed • more rapid and extensive microbe inactivation at higher pH levels.
Granular Media Filtration • Used to remove suspended particles (turbidity) incl. microbes. • Historically, two types of granular media filters: • Slow sand filters: uniform bed of sand; • low flow rate <0.1 GPM/ft2 • biological process: 1-2 cm “slime” layer (schmutzdecke) • Rapid sand filters: 1, 2 or 3 layers of sand/other media; • >1 GPM/ft2 • physical-chemical process; depth filtration • Diatomaceous earth filters • fossilized skeletons of diatoms (crystalline silicate); powdery deposit; few 10s of micrometers; porous
Slow Sand Filters • Less widely used for large US municipal water supplies • Effective; widely used in Europe; small water supplies; developing countries • Filter through a 3‑ to 5‑foot deep bed of unstratified sand • flow rate ~0.05 gallons per minute per square foot. • Biological growth develops in the upper surface of the sand is primarily responsible for particle and microbe removal. • Effective without pretreatment of the water by coagulation‑flocculation • Periodically clean by removing, cleaning and replacing the upper few inches of biologically active sand
Microbial Reductions by Slow Sand Filtration • Effective in removing enteric microbes from water. • Virus removals >99% in lab models of slow sand filters. • Up to 4 log10; no infectious viruses recovered from filter effluents • Field studies: • naturally occurring enteric viruses removals • 97 to >99.8 percent; average 98% overall; • Comparable removals of E. coli bacteria. • Virus removals=99‑99.9%; • high bacteria removals (UK study) • Parasite removals: Giardia lamblia cysts effectively removed • Expected removals ~ 99%
Rapid Granular Media Filter Operation Sometimes multiple layers of different media
Roughing Filter • Used in developing countries • inexpensive • low maintenance • local materials • Remove large solids • Remove microbes • 1-2 log10 bacterial reduction • 90% turbidity reduction
Microbe Reductions by Rapid Granular Media Filters • Ineffective to remove enteric microbes unless preceded by chemical coagulation‑flocculation. • Preceded chemical coagulation‑flocculation & sedimentation • Enteric microbe removals of 90->99 % achieved. • Field (pilot) studies: rapid sand filtration preceded by iron coagulation‑flocculation: virus removal <50% (poor control?). • Giardia lamblia: removals not always high; related to turbidity removal; >99% removals reported when optimized. • Removal not high unless turbidity is reduced to ~0.2 NTU. • Lowest removals shortly after filter backwashing • Microbes primarily removed in filter by entrapped floc particles. • Overall, can achieve 90% microbial removals from water when preceded by chemical coagulation‑flocculation.
Microbe Reductions by Chemical Coagulation-Flocculation and Filtration of River Water by Three Rx Plants in The Netherlands Plant 1 used two stages of iron coagulation‑flocculation‑sedimentation. Plant 2 used iron coagulation‑flocculation‑sedimentation and rapid filtration Plant 3 used iron coagulation‑flotation‑rapid filtration.
Cryptosporidium Removals by Sand Filtration Reduction Type Rate (M/hr) Coagulation % (log10) Rapid, shallow 5 No 65 (0.5) Rapid, shallow 5 Yes 90 (1.0) Rapid, deep 6 Yes 99.999 (5.0) Slow 0.2 No 99.8 (2.7)
Cryptosporidium Removal by Coagulation and Direct Filtration Log10 Reduction of Run No. Cryptosporidium Turbidity 1 3.1 1.3 2 2.8 1.2 3 2.7 0.7 4 1.5 0.2* Mean 2.5 0.85 Raw water turbidity = 0.0 - 5.0 NTU Alum coagulation-flocculation; Anthracite-sand-sand filtration; 5 GPM/ft2 *Suboptimum alum dose Ongerth & Pecoraro. JAWWA, Dec., 1995
Reported Removals of Cryptosporidium Oocysts by Physical-Chemical Water Treatment Processes (Bench, Pilot and Field Studies) Process Log10 Reduction Clarification by: Coagulation flocculation-sedimentation <1 - 2.6 or Flotation Rapid Filtration (pre-coagulated) 1.5 - >4.0 Both Processes <2.5 - >6.6 Slow Sand Filtration >3.7 Diatomaceous Earth Filtration >4.0 Coagulation + Microfiltration >6.0 Ultrafiltration >6.0
Cryptosporidium Reductions by Coagulation and Filtration Laboratory studies on oocyst removal: - Jar test coagulation with 1 hr. setting = 2.0 - 2.7 log10 - Sand filtration, no coagulant, 10 cm bed depth = 0.45 log10 - Sand filtration, plus coagulation, 10 cm bed depth = 1.0 log10 Gregory et al., 1991. Final Report. Dept. of the Environ., UK
Membrane Filters • More recent development and use in drinking water • Microfilters: several tenths of μM to μM diameter pore size • nano- & ultra-filters: retention by molecular weight cutoff • Typically 1,000-100,000 MWCO • Reverse osmosis filters: pore size small enough to remove dissolved salts; used to desalinate (desalt) water as well as particle removal • High >99.99% removal of cellular microbes • Virus removals high >9.99% in ultra-, nano- and RO filters • Virus removals lower (~99%) by microfilters • Membrane and membrane seal integrity critical to effective performance
Cryptosporidium Reductions by Membrane Filtration Log10 Cryptosporidium Reduction Membrane, Type Pore Size A, MF 0.2 µm >4.4 B, MF 0.2 µm >4.4 C, MF 0.1 µm 4.2->4.8 D, UF 500 KD >4.8 E, UF 300 KD >4.8 F, UF 100 KD >4.4 MF = microfilter filter; UF = ultrafilter Jacangelo et al., JAWWA, Sept., 1995
Adsorbers and Filter-Adsorbers Adsorbers: • Granular activated carbon adsorption • remove dissolved organics • poor retention of pathogens, esp. viruses • biologically active; develops a biofilm • can shed microbes into water Filter-adsorbers • Sand plus granular activated carbon • reduces particles and organics • biologically active • microbial retention is possible
Disinfection • Any process to destroy or prevent the growth of microbes • Intended to inactivate (destroy the infectivity of) the microbes by physical, chemical or biological processes • Inactivation is achieved by altering or destroying essential structures or functions within the microbe • Inactivation processes include denaturation of: • proteins (structural proteins, enzymes, transport proteins) • nucleic acids (genomic DNA or RNA, mRNA, tRNA, etc) • lipids (lipid bilayer membranes, other lipids)
Properties of an Ideal Disinfectant Broad spectrum: active against all microbes Fast acting: produces rapid inactivation Effective in the presence of organic matter, suspended solids and other matrix or sample constituents Nontoxic; soluble; non-flammable; non-explosive Compatible with various materials/surfaces Stable or persistent for the intended exposure period Provides a residual (sometimes this is undesirable) Easy to generate and apply Economical
DISINFECTION AND MICROBIAL INACTIVATION KINETICS First Order Multihit Log Survivors Retardant Contact Time
Disinfection Kinetics • Disinfection is a kinetic process • Increased inactivation with increased exposure or contact time. • Chick's Law: disinfection is a first‑order reaction. (NOT!) • Multihit-hit or concave up kinetics: initial slow rate; multiple targets to be “hit” • Concave down or retardant kinetics: initial fast rate; decreases over time • Different susceptibilities of microbes to inactivation; heterogeneous population • Decline of of disinfectant concentration over time • CT Concept: Disinfection can be expressed at the product of disinfectant concentration X contact time • Applies best when disinfection kinetics are first order • Disinfectant concentration and contact time have an equal effect on CT products • Applies less well when either time ofrconcentration is more important.
Disinfectants in Water Treatment • Free Chlorine • Monochloramine • Ozone • Chlorine Dioxide • UV Light • Low pressure mercury lamp (monochromatic) • Medium pressure mercury lamp (polychromatic) • Pulsed broadband radiation • Boiling • At household level in many countries and for emergencies in other countries (USA) • Iodine • Short-term use; long-term use a health concern
Summary Properties of Water Disinfectants • Free chlorine: HOCl (hypochlorous) acid and OCl- (hypochlorite ion) • HOCl at low and pH OCl- at highpH; HOCl more potent germicide than OCl- • strong oxidant; relatively stable in water (provides a disinfectant residual) • Chloramines: mostly NH2Cl: weak oxidant; provides a stable residual • ozone, O3: strong oxidant; provides no residual (too volatile, reactive) • Chlorine dioxide, ClO2,: strong oxidant; unstable (dissolved gas) • Concerns due to health risks of chemical disinfectants and their by‑products (DBPs), especially free chlorine and its DBPs • UV radiation • low pressure mercury lamp: low intensity; monochromatic at 254 nm • medium pressure mercury lamp: higher intensity; polychromatic 220-280 nm) • reacts primarily with nucleic acids: pyrimidine dimers and other alterations • Boiling: efficient kill; no residual protection; fuel/environmental costs
Disinfection of Microbes in Water: Conventional Methods used in the Developed World • Historically, the essential barrier to prevention and control of waterborne microbial transmission and waterborne disease. • Free chlorine: HOCl (hypochlorous) acid and OCl- (hypochlorite ion) • HOCl at lower pH and OCl- at higher pH; HOCl a more potent germicide than OCl- • strong oxidant and relatively stable in water (provides a disinfectant residual) • Chloramines: mostly NH3Cl: weak oxidant; provides a stable residual • ozone, O3 , strong oxidant; provides no residual (too volatile and reactive) • Chlorine dioxide, ClO2,, string oxidant but not very stable residual • Concerns due to health risks of chemical disinfectants and their by‑products (DBPs), especially free chlorine and its DBPs • UV radiation • low pressure mercury lamp: low intensity; monochromatic at 254 nm • medium pressure mercury lamp: higher intensity; polychromatic 220-280 nm) • reacts primarily with nucleic acids: pyrimidine dimers and other alterations
Factors Influencing Disinfection Efficacy and Microbial Inactivation Resistance: Least Microbe type: Resistance to chemical disinfectants: • Vegetative bacteria: Salmonella, coliforms, etc.: low • Enteric viruses: coliphages, HAV, Noroviruses: Moderate • Bacterial Spores • Fungal Spores • Protozoan (oo)cysts, spores, helminth ova, etc. • Cryptosporidium parvum oocysts • Giardia lamblia cysts • Ascaris lumbricoides ova • Acid-fast bacteria: Mycobacterium spp. High Most
Factors Influencing Disinfection Efficacyand Microbial Inactivation (Continued) Type of Disinfectant and Mode of Action Free chlorine: strong oxidant; oxidizes various protein sulfhydryl groups; alters membrane permeability; also, oxidize/denature nucleic acid components, etc. Ozone: strong oxidant; ditto free chlorine Chlorine dioxide: strong oxidant; ditto free chlorine Electrochemically generated mixed oxidants: strong oxidant; probably ditto free chlorine Combined chlorine/chloramines: weak oxidant; denatures sulfhydryl groups of proteins Ultraviolet radiation: nucleic acid damage: thymidine dimer formation, strand breaks, etc.
Factors Influencing Disinfection Efficacyand Microbial Inactivation, Continued Microbial strain differences and microbial selection: • Disinfectant exposure may select for resistant strains Physical protection: • Aggregation • particle-association • protection within membranes and other solids Chemical factors: • pH • Salts and ions • Soluble organic matter • Other chemical (depends on the disinfectant)
Some Factors Influencing Disinfection Efficacy and Microbial Inactivation - Bacteria • Surface properties conferring susceptibility or resistance: • Resistance: Spore; acid fast (cell wall lipids); capsule; pili • Susceptibility: sulfhydryl (-SH) groups; phospholipids; enzymes; porins and other transport structures, etc. • Physiological state and resistance: • Antecedent growth conditions: low-nutrient growth increases resistance to inactivation • Injury; resuscitation and injury repair; • disinfectant exposure may selection for resistant strains • Physical protection: • Aggregation; particle-association; biofilms; occlusion (embedded within protective material), association with or inside eucaryotes; corrosion/tuberculation
Some Factors Influencing Disinfection Efficacy and Inactivation - Viruses Virus type, structure and composition: • Envelope (lipids): typically labile to disinfectants • Capsid structures and capsid proteins (change in conformation state) • Nucleic acids: genomic DNA, RNA; # strands • Glycoproteins: often on virus outer surface; typically labile to disinfectants Physical state of the virus(es): • Aggregated • Particle-associated • Embedded within other materia (within membranes)
Factors Influencing Disinfection Efficacy and Microbial Inactivation - Parasites Parasite type, structure and composition: Protozoan cysts, oocysts and spores Some are very resistant to chemical disinfectants Helminth ova: some are very resistant to chemical disinfection, drying and heat. • Strain differences and selection: Disinfectant exposure may select for resistant strains • Physical protection: Aggregation; particle-association; protection within other solids
Factors Influencing Disinfection Efficacy and Microbial Inactivation - Water Quality • Particulates: protect microbes from inactivation; consume disinfectant • Dissolved organics: protect microbes from inactivation; consumes or absorbs (for UV radiation) disinfectant; Coat microbe (deposit on surface) • pH: influences microbe inactivation by some agents • free chlorine more effective at low pH where HOCl predominates • neutral HOCl species more easily reaches microbe surface and penetrates) • negative charged OCl- has a harder time reaching negatively charged microbe surface • chlorine dioxide is more effective at high pH • Inorganic compounds and ions: influences microbe inactivation by some disinfectants; depends on disinfectant
Factors Influencing Disinfection Efficacy and Microbial Inactivation - Reactor Design, Mixing & Hydraulic Conditions Disinfection kinetics are better in plug-flow (pipe) reactors than in batch (back-mixed) reactors Disinfectant Disinfectant Flow Plug-flow or Pipe Reactor Batch or Back-mixed Reactor
Assumes: all organisms are identical death (inactivation) results from a first-order or “single-hit” or exponential reaction. Chick's law: - dN/dT = kN where: N = number (concentration) of organisms T = time ln Nt/No = -kT where No = initial number of organisms Nt = number of organisms remaining at time = T No = initial number of organisms (T = 0) Also: N/No = e-kT Disinfection Kinetics: Chick’s LawFirst-Order or Exponential Kinetics
DISINFECTION AND MICROBIAL INACTIVATION KINETICS First Order Multihit Log Survivors Retardant Contact Time (arithmetic scale)
Microbial Inactivation Kinetics First-order or exponential kinetics assumed • Chick’s Law and Chick-Watson Model • Assumption is often not met in practice • CT concept wrongly assumes 1st-order kinetics always occur Departures from 1st-order kinetics are common • Retardant curves: “persistent fraction”; mixed populations; aggregation • Declining rate: decline in disinfectant concentration over time. • “Shoulder” curves: multihit kinetics; aggregation
Types of Disinfection Kinetics • Disinfection is a kinetic process • Increased inactivation with increased exposure or contact time. • Chick's Law: disinfection is a first‑order reaction. (NOT!) • Multihit-hit or concave up kinetics: initial slow rate; multiple targets to be “hit”; diffusion-limitions in reaching “targets” • Concave down or retardant kinetics: initial fast rate that decreases over time • Different susceptibilities of microbes to inactivation; heterogeneous population • Decline of of disinfectant concentration over time
Disinfection Activity and the CT Concept • Disinfection activity can be expressed as the product of disinfection concentration (C) and contact time (T)Assumes first order kinetics (Chick’s Law) such that disinfectant concentration and contact time have the same “weight” or contribution in disinfection activity and in contributiong to CT • Example: If CT = 100 mg/l-minutes, then • If C = 10 mg/l, T must = 10 min. in order to get CT = 100 mg/l-min. • If C = 1 mg/l, then T must = 100 min. to get CT = 100 mg/l-min. • If C = 50 mg/l, then T must = 2 min. to get CT = 100 mg/l-min. • So, any combinationof C and T giving a product of 100 is acceptable because C and T are interchangable • The CT concept fails if disinfection kinetics do not follow Chick’s Law (are not first-order or exponential)
Factors Influencing Disinfection of Microbes • Microbe type: disinfection resistance from least to most:vegetative bacteria viruses protozoan cysts, spores and eggs • Type of disinfectant: order of efficacy against Giardia from best to worst • O3 ClO2 iodine/free chlorine chloramines • BUT, order of effectiveness varies with type of microbe • Microbial aggregation: • protects microbes from inactivation • microbes within aggregates not be readily reached by the disinfectant • Particulates: protects from inactivation; shielded/embedded in particles • Dissolved organics: protects • consumes or absorbs (UV radiation) disinfectant; coats microbes • Inorganic compounds and ions: effects vary with disinfectant • pH: effects depend on disinfectant. • Free chlorine more biocidal at low pH where HOCl predominates. • Chlorine dioxide more microbiocidal at high pH • Reactor design, mixing and hydraulic conditions; better activity in "plug flow" than in "batch‑mixed" reactors.
Inactivation of Cryptosporidium Oocysts in Water by Chemical Disinfectants Disinfectant CT99 (mg-min/L) Reference Free Chlorine 7,200+ Korich et al., 1990 Monochloramine 7,200+ Korich et al., 1990 Chlorine Dioxide >78 Korich et al., 1990 Mixed oxidants Venczel et al., 1997 <120 Ozone ~3-18 Finch et al., 1994 Korich et al., 1990 Owens et al., 1994 C. parvum oocysts inactivated by low doses of UV radiation: <10 mJoules/cm2
Free Chlorine - Background and History • Considered to be first used in 1905 in London • But, electrochemically generated chlorine from brine (NaCl) was first used in water treatment the late 1800s • Reactions for free chlorine formation: Cl2 (g) + H2O <=> HOCl + H+ + Cl- HOCl <=> H+ + OCl- • Chemical forms of free chlorine: Cl2 (gas), NaOCl (liquid), or Ca(OCl)2 (solid) • Has been the “disinfectant of choice” in US until recently. • recommended maximum residual concentration of free chlorine < 5 mg/L (by US EPA) • Concerns about the toxicity of free chlorine disinfection by-products (trihalomethanes and other chlorinated organics)