Download
1 / 1
10 likes | 122 Vues
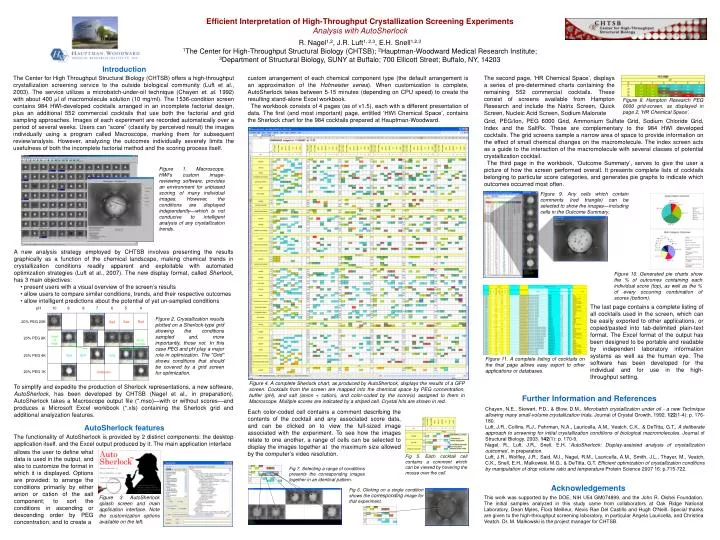
Figure 8. Hampton Research PEG 6000 grid-screen, as displayed in page 2, ‘HR Chemical Space’. Figure 9. Any cells which contain comments (red triangle) can be selected to show the images—including cells in the Outcome Summary.

E N D
Figure 8. Hampton Research PEG 6000 grid-screen, as displayed in page 2, ‘HR Chemical Space’. Figure 9. Any cells which contain comments (red triangle) can be selected to show the images—including cells in the Outcome Summary. Figure 10. Generated pie charts show the % of outcomes containing each individual score (top), as well as the % of every occurring combination of scores (bottom). pH 10 9 8 7 6 5 4 Bad Bad Bad 20% PEG 20K Small to large Small to large 20% PEG 8K Grid Figure 11. A complete listing of cocktails on the final page allows easy export to other applications or databases. Grid Grid Grid 20% PEG 4K Grid Grid Unknown 20% PEG 1K Figure 4. A complete Sherlock chart, as produced by AutoSherlock, displays the results of a GFP screen. Cocktails from the screen are mapped into the chemical space by PEG concentration, buffer (pH), and salt (anion + cation), and color-coded by the score(s) assigned to them in Macroscope. Multiple scores are indicated by a striped cell. Crystal hits are shown in red. Fig 5. Each cocktail cell contains a comment which can be viewed by hovering the mouse over the cell. Fig 7. Selecting a range of conditions presents the corresponding images together in an identical pattern. Fig 6. Clicking on a single condition shows the corresponding image for that experiment. Figure 3. AutoSherlock splash screen and main application interface. Note the customization options available on the left. Efficient Interpretation of High-Throughput Crystallization Screening ExperimentsAnalysis with AutoSherlock R. Nagel1,2, J.R. Luft1, 2,3, E.H. Snell1,2,3 1The Center for High-Throughput Structural Biology (CHTSB); 2Hauptman-Woodward Medical Research Institute; 3Department of Structural Biology, SUNY at Buffalo; 700 Ellicott Street; Buffalo, NY, 14203 Introduction The Center for High Throughput Structural Biology (CHTSB) offers a high-throughput crystallization screening service to the outside biological community (Luft et al., 2003). The service utilizes a microbatch-under-oil technique (Chayen et. al. 1992) with about 400 ml of macromolecule solution (10 mg/ml). The 1536-condition screen contains 984 HWI-developed cocktails arranged in an incomplete factorial design, plus an additional 552 commercial cocktails that use both the factorial and grid sampling approaches. Images of each experiment are recorded automatically over a period of several weeks. Users can “score” (classify by perceived result) the images individually using a program called Macroscope, marking them for subsequent review/analysis. However, analyzing the outcomes individually severely limits the usefulness of both the incomplete factorial method and the scoring process itself. custom arrangement of each chemical component type (the default arrangement is an approximation of the Hofmeister series). When customization is complete, AutoSherlock takes between 5-15 minutes (depending on CPU speed) to create the resulting stand-alone Excel workbook. The workbook consists of 4 pages (as of v1.5), each with a different presentation of data. The first (and most important) page, entitled ‘HWI Chemical Space’, contains the Sherlock chart for the 984 cocktails prepared at Hauptman-Woodward. The second page, ‘HR Chemical Space’, displays a series of pre-determined charts containing the remaining 552 commercial cocktails. These consist of screens available from Hampton Research and include the Natrix Screen, Quick Screen, Nucleic Acid Screen, Sodium Malonate Grid, PEG/Ion, PEG 6000 Grid, Ammonium Sulfate Grid, Sodium Chloride Grid, Index and the SaltRx. These are complementary to the 984 HWI developed cocktails. The grid screens sample a narrow area of space to provide information on the effect of small chemical changes on the macromolecule. The index screen acts as a guide to the interaction of the macromolecule with several classes of potential crystallization cocktail. The third page in the workbook, ‘Outcome Summary’, serves to give the user a picture of how the screen performed overall. It presents complete lists of cocktails belonging to particular score categories, and generates pie graphs to indicate which outcomes occurred most often. Figure 1. Macroscope, HWI’s custom image-reviewing software, provides an environment for unbiased scoring of many individual images. However, the conditions are displayed independently—which is not conducive to intelligent analysis of any crystallization trends. A new analysis strategy employed by CHTSB involves presenting the results graphically as a function of the chemical landscape, making chemical trends in crystallization conditions readily apparent and exploitable with automated optimization strategies (Luft et al., 2007). The new display format, called Sherlock, has 3 main objectives: • present users with a visual overview of the screen’s results • allow users to compare similar conditions, trends, and their respective outcomes • allow intelligent predictions about the potential of yet un-sampled conditions The last page contains a complete listing of all cocktails used in the screen, which can be easily exported to other applications, or copied/pasted into tab-delimited plain-text format. The Excel format of the output has been designed to be portable and readable by independent laboratory information systems as well as the human eye. The software has been developed for the individual and for use in the high-throughput setting. Figure 2. Crystallization results plotted on a Sherlock-type grid showing the conditions sampled and, more importantly, those not. In this case PEG and pH play a major role in optimization. The “Grid” shows conditions that should be covered by a grid screen for optimization. To simplify and expedite the production of Sherlock representations, a new software, AutoSherlock, has been developed by CHTSB (Nagel et al., in preparation). AutoSherlock takes a Macroscope output file (*.mso)—with or without scores—and produces a Microsoft Excel workbook (*.xls) containing the Sherlock grid and additional analyzation features. Further Information and References Chayen, N.E., Stewart, P.D., & Blow, D.M., Microbatch crystallization under oil - a new Techniqueallowing many small-volume crystallization trials. Journal of Crystal Growth, 1992. 122(1-4): p. 176-180. Luft, J.R., Collins, R.J., Fehrman, N.A., Lauricella, A.M., Veatch, C.K., & DeTitta, G.T., A deliberate approach to screening for initial crystallization conditions of biological macromolecules. Journal of Structural Biology, 2003. 142(1): p. 170-9. Nagel, R., Luft, J.R., Snell, E.H. ‘AutoSherlock: Display-assisted analysis of crystallization outcomes’, in preparation. Luft, J.R., Wolfley, J.R., Said, M.I., Nagel, R.M., Lauricella, A.M., Smith, J.L., Thayer, M., Veatch, C.K., Snell, E.H., Malkowski, M.G., & DeTitta, G.T. Efficient optimization of crystallization conditions by manipulation of drop volume ratio and temperature Protein Science 2007 16: p.715-722. Each color-coded cell contains a comment describing the contents of the cocktail and any associated score data, and can be clicked on to view the full-sized image associated with the experiment. To see how the images relate to one another, a range of cells can be selected to display the images together at the maximum size allowed by the computer’s video resolution. AutoSherlock features The functionality of AutoSherlock is provided by 2 distinct components: the desktop application itself, and the Excel output produced by it. The main application interface allows the user to define what data is used in the output, and also to customize the format in which it is displayed. Options are provided: to arrange the conditions primarily by either anion or cation of the salt component; to sort the conditions in ascending or descending order by PEG concentration; and to create a Acknowledgements This work was supported by the DOE, NIH U54 GM074899, and the John R. Oishei Foundation. The initial samples analyzed in this study came from collaborators at Oak Ridge National Laboratory, Dean Myles, Flora Meilleur, Alexis Rae Del Castillo and Hugh O'Neill. Special thanks are given to the high-throughput screening laboratory, in particular Angela Lauricella, and Christina Veatch. Dr. M. Malkowski is the project manager for CHTSB.