Download
1 / 48
480 likes | 484 Vues
Central Massachusetts Regional Health Dialogue. Massachusetts Department of Public Health May 30, 2007. Goals for holding regional dialogues. Introduce new DPH leadership Present latest health data on your particular region

E N D
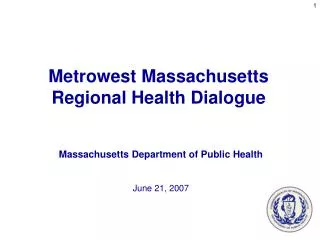
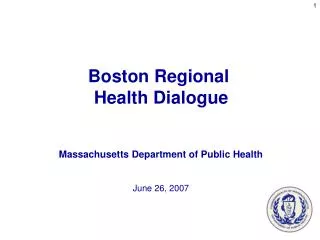
Central Massachusetts Regional Health Dialogue Massachusetts Department of Public Health May 30, 2007
Goals for holding regional dialogues • Introduce new DPH leadership • Present latest health data on your particular region • Talk with residents and providers about data and identify areas of need • Gather feedback to inform process of setting DPH priorities
Goals of New DPH leadership • Use data and community input to set new priorities & reshape the Department • Rely on science and evidence-based process to guide the work • Strengthen ties with and support for local health and local agencies • Increase resources to and visibility of public health in Massachusetts
Timetable • Hold 8 regional dialogues with comprehensive data review and identification of key health concerns (by July) • Identify short list of top priorities by end of August • Hold second round of community dialogues to discuss action plans/results by end of calendar year
Source: MDPH, Health Information, Statistics, Research and Evaluation Bureau, Research & Epidemiology Program
A few comments about the limitations of this presentation • A regional analysis has its drawbacks • Variability within a region – urban vs. rural/suburban (i.e. Worcester vs. the rest of the region) • Variability by sub-population – race matters, poverty matters • Our data don’t reflect all the important health indicators
Smallest New Braintree: 1,090 Largest Worcester:179,839 Population in Towns inCentral Region: 2005 Source: MDPH, Health Information, Statistics, Research and Evaluation Bureau, Research & Epidemiology Program
Race and Ethnic Breakdown of PopulationCentral Region and Massachusetts: 2005 Central Region Massachusetts * Non-Hispanics American Indian* 0.3% American Indian* 0.2% Asian* 3.3% Asian* 4.9% Hispanic 7.3% Hispanic 7.9% Black* 3.2% Black* 6.0% White* 86.0% White* 81.0% Population Total = 844,700 Population Total = 6,436,940 Source: MDPH, Health Information, Statistics, Research and Evaluation Bureau, Research & Epidemiology Program
Race and Ethnic Breakdown of PopulationWorcester and Massachusetts: 2005 * Non-Hispanics Worcester Massachusetts Population Total = 179,839 Population Total = 6,436,940 Source: MDPH, Health Information, Statistics, Research and Evaluation Bureau, Research & Epidemiology Program
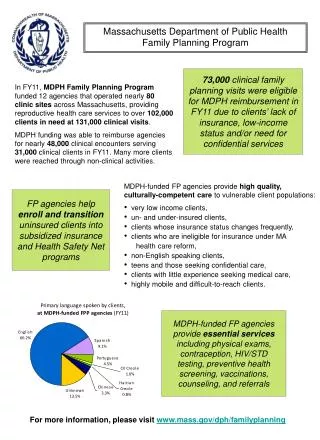
Spanish Spoken at Home Central Region: 2000 9.9% 9.9% Source: MDPH, Health Information, Statistics, Research and Evaluation Bureau, Research & Epidemiology Program
Socio-Demographic IndicatorsCentral Region and Massachusetts: 2000 Source: MDPH, Health Information, Statistics, Research and Evaluation Bureau, Research & Epidemiology Program
Highest and Lowest Per Capita Income Communities1 in Central Region: 2000 High Low 1 Selected among communities with at least 10,000 population Source: MDPH, Health Information, Statistics, Research and Evaluation Bureau, Research & Epidemiology Program
Infant Mortality Rates by Race/Ethnicity Central Region and Massachusetts: 2003-2005 * Statistically different from state (p ≤.05) NA= Calculations based on less than 5 events are excluded Source: MDPH, Health Information, Statistics, Research and Evaluation Bureau, Research & Epidemiology Program
Highest Infant Mortality Rates Among the 30 Largest Communities1 Massachusetts: 2005 1Selected among the 30 Massachusetts communities with the largest populations. IMR = infant deaths per 1,000 live births. 2A Confidence Interval for a population parameter is a range in which you are 95% certain that the true population estimate is within. It is a function of variability and the number of events. Statistically different from state (p ≤.05)– Red (*) Statistically worse than state- Green (**) statistically better than state Source: MDPH, Health Information, Statistics, Research and Evaluation Bureau, Research & Epidemiology Program
Infant Mortality Rate (IMR)Worcester: 1990-2005 Rate = infant deaths per 1,000 live births * Statistically higher than state (p ≤.05) Source: MDPH, Health Information, Statistics, Research and Evaluation Bureau, Research & Epidemiology Program
Leading Causes of DeathCentral Region and Massachusetts:2005 Source: MDPH, Health Information, Statistics, Research and Evaluation Bureau, Research & Epidemiology Program
Adults who are Overweight1by EOHHS Region, Massachusetts: 1995 & 2005 Statistically different from state (p ≤.05)– Red (*) Statistically worse than state- Green (**) statistically better than state 1 Overweight: BMI greater than or equal to 25 Source: MDPH, Health Information, Statistics, Research and Evaluation Bureau, Massachusetts Behavioral Risk Factor Surveillance System (BRFSS), Health Survey Program
Heart Disease Mortality Rates by EOHHS Region Massachusetts:2003-2005 * * ** Statistically different from state (p ≤.05)– Red (*) Statistically worse than state- Green (**) statistically better than state Age-adjusted to the 2000 US standard population. Source: Hospital Discharge Dataset System, Massachusetts Division of Health Care Finance and Policy
Heart Disease Death Rate by Race/EthnicityCentral Region and Massachusetts: 2003-2005 * * Statistically different from state (p ≤.05)– Red (*) Statistically worse than state- Green (**) statistically better than state Age-adjusted to the 2000 US standard population. Source: Preliminary 2005 MA Death file, Registry of Vital Records MDPH, Health Information, Statistics, Research and Evaluation Bureau, Research & Epidemiology Program
Prevalence of Diabetes Massachusetts: 1994-2005 Source: MDPH, Health Information, Statistics, Research and Evaluation Bureau, Massachusetts Behavioral Risk Factor Surveillance System (BRFSS), Health Survey Program
Diabetes Mortality Rates by EOHHS Region Massachusetts:2003-2005 * * ** Statistically different from state (p ≤.05)– Red (*) Statistically worse than state- Green (**) statistically better than state Age-adjusted to the 2000 US standard population. Source: Preliminary 2005 MA Death file, Registry of Vital Records MDPH, Health Information, Statistics, Research and Evaluation Bureau, Research & Epidemiology Program
Diabetes Death Rate by Race/EthnicityCentral Region and Massachusetts: 2003-2005 * Statistically different from state (p ≤.05)– Red (*) Statistically worse than state- Green (**) statistically better than state Age-adjusted to the 2000 US standard population. Source: Preliminary 2005 MA Death file, Registry of Vital Records MDPH, Health Information, Statistics, Research and Evaluation Bureau, Research & Epidemiology Program
Summary Cancer Incidence Ratesby EOHHS Region, Massachusetts: 1999-2003 Better Outcome (significantly different from state) Worse Outcome (significantly different from state) Source: Cancer Registry MDPH, Health Information, Statistics, Research and Evaluation Bureau, Health Information, Statistics, Research and Evaluation Bureau, Research & Epidemiology Program
Summary Indicators for Cancer Screening by EOHHS Regions, Massachusetts: 2005 *40 years and older, † 50 years and older Better Outcome (significantly different from state) Worse Outcome (significantly different from state) Source: MDPH, Health Information, Statistics, Research & Evaluation Bureau, Health Survey Program
Adults who Currently Smoke by EOHHS Region, Massachusetts: 2005 ** Statistically different from state (p ≤.05)– Red (*) Statistically worse than state, Green (**) statistically better than state Source: MDPH, Health Information, Statistics, Research and Evaluation Bureau, Massachusetts Behavioral Risk Factor Surveillance System (BRFSS), Health Survey Program
Percent of Mothers Smoking During Pregnancy for Largest Communities Central Region: 2005 • % SmokersBirths • Massachusetts 7.2% 5,55576,653 • Central Region 7.6% 79710,512 • Lowest • Shrewsbury 1.6%** 7429 • Grafton 2.7%** 7260 • Holden 3.5%** 6171 • Highest • Gardner 22.9%* 54236 • Southbridge 14.2%* 34240 • Fitchburg 12.8%* 73571 Statistically different from state (p ≤.05)– Red (*) Statistically worse than state- Green (**) statistically better than state Source: MDPH, Health Information, Statistics, Research and Evaluation Bureau, Research & Epidemiology Program
Adults who Used Illicit Drugs in Past Month by EOHHS Region, Massachusetts: 2005 Statistically different from state (p ≤.05)– *Red: Statistically worse than state- **green: statistically better than state Source: MDPH, Health Information, Statistics, Research and Evaluation Bureau, Massachusetts Behavioral Risk Factor Surveillance System (BRFSS), Health Survey Program
Opioid-Related Emergency Department Visit Rateby Race/EthnicityCentral Region and Massachusetts: 2003-2005 * * * ** ** Statistically different from state (p ≤.05)– Red (*) Statistically worse than state, Green (**) statistically better than state Age-adjusted to the 2000 US standard population. Source:MDPH,Bureau of Substance Abuse Services, Health Information, Statistics, Research and Evaluation Bureau, Research & Epidemiology Program
Causes of Injury Deaths Central Region and Massachusetts: 2005 Central Region Total Injuries = 329 Massachusetts Total Injuries = 2,657 Other 20% Other 21% Poisonings 28% Poisonings 30% Firearm 7% Firearm 8% Falls 11% Motor Vehicle-related 20% Falls 11% Motor Vehicle-related 18% Suffocation, Hanging, or Strangulation 13% Suffocation, Hanging, or Strangulation 13% Source: MDPH, Health Information, Statistics, Research and Evaluation Bureau, Research & Epidemiology Program
Hospital Discharge Rates for Motor Vehicle-related Injuries by EOHHS Region and Massachusetts: 2003-2005 Statistically different from state (p ≤.05)– Red (*) Statistically worse than state, Green (**) statistically better than state Age-adjusted to the 2000 US standard population. Source: Hospital Discharge Dataset System, Massachusetts Division of Health Care Finance and Policy
Hospitalization Rates for Fall-Related Injuries Ages 65+ by EOHHS Region Massachusetts: 2003-2005 Statistically different from state (p ≤.05)– Red (*) Statistically worse than state- Green (**) statistically better than state Source: MDPH, Health Information, Statistics, Research and Evaluation Bureau, Research & Epidemiology Program
HIV/AIDS Death Rate by Race/EthnicityWorcester & Central Region vs. Massachusetts: 2003-2005 * * ** Statistically different from state (p ≤.05)–Red (*) Statistically worse than state, Green (**) statistically better than state Age-adjusted to the 2000 US standard population. Source: MDPH, Health Information, Statistics, Research and Evaluation Bureau, Research & Epidemiology Program
Summary Infectious Disease Indicators by EOHHS Regions Worse Outcome (significantly different from state) Best Outcome (significantly different from state) Source: MDPH, Center for Health Information, Statistics, Research & Evaluation, Research & Epidemiology Program
Pediatric Asthma Prevalence Among School Children, Grades K-8 by EOHHS Region, Massachusetts: 2005-2006 * * ** ** ** Statistically different from state (p ≤.05)–Red (*) Statistically worse than state, Green (**) statistically better than state Source: MDPH, Environmental Health Bureau , Pediatric Asthma Surveillance (2005-2006)
Asthma Emergency Department Visit Rates Children Ages 0-14 Central Region and Massachusetts: 2005 * ** * Statistically different from state (p ≤.05)–Red (*) Statistically worse than state, Green (**) statistically better than state Source: Division of Health Care Finance and Policy. Calendar Year 2005. Emergency Visits
Source: Division of Health Care Finance and Policy. Calendar Year 2004-2005. Emergency Visits
Key Health Observations in Central Massachusetts • Racial and Ethnic disparities are major factors - Latinos and Blacks health disparities across several indicators are a major concern • Overweight/obesity is an increasing health risk - contributes to rising diabetes incidence • The region’s residents are disproportionately affected by: • Infant mortality rates • Smoking rates • AIDS/HIV and Hep C • Heroin/opioid related incidents/deaths • Motor vehicle injuries
How Can You Access these Data? • Hard Copies: (617) 624-5674 • Data Questions: (617) 624-5640 • TDD/TTY: (617) 624-6001 • DPH Website: • mass.gov/dph/bhsre/resep/resep.htm